Warren Buffett famously remarked that “if you don’t figure out how to make money while you sleep, you’ll work until you die.” Of course, avoiding this fate can also be achieved by making extra money during the day in ways that don’t interfere with your regular job. What I’m about to discuss falls more in this latter category, but there are other strategies that fit with Buffett’s remark. Maybe we’ll address those on a different occasion. In the meantime, here’s an idea to play around with and test for yourself. For those of you unfamiliar with the subject, terms in bold non-italic type are defined in a glossary following the essay, and helpful resources are included at the end. Some common trading terms not necessarily used in this article but relevant to its concerns are cross-referenced and included in the glossary, which I recommend reading in its entirety if you’re new to trading.
The Idea
Any physicist will tell you it’s easier to predict the general motion of a large collection of particles than the exact motion of any individual particle within the collection. Of course, if you have additional information relevant to the motion of a given particle, that’s another matter, and knowing how to work with that information is also important. What we’re interested in at the moment, however, is a simple way of anticipating the directional movement of a larger collection, not the behavior of its individual constituents.
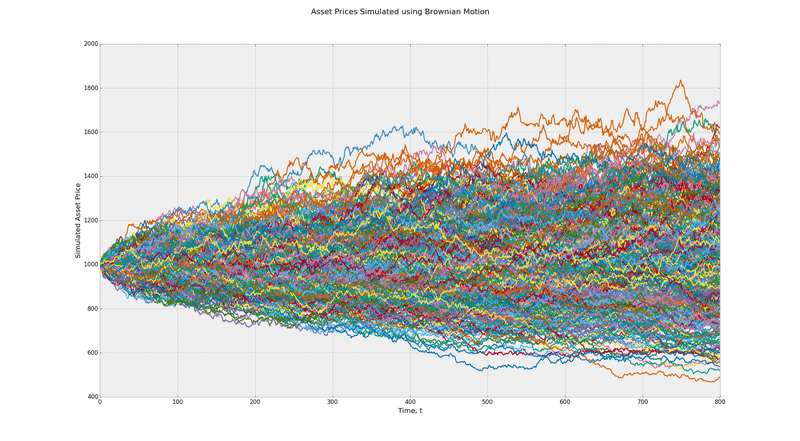
A large collection of stocks is like a collection of particles and you can think about its movement in the same way. For instance, what if you had a high-probability advance glimpse into the daily movement of stock indices like the S&P 500, the Dow Jones Industrial, the NASDAQ, and the various Russell Indexes? If you could anticipate a directional move with high probability, this knowledge would allow you to leverage a position with options in one of the index ETFs based on these market indices (e.g., SPY, DIA, QQQ, and IWM), so that even a small intraday movement could produce a substantial gain. If you took care in setting up this trade to minimize your losses if it went against you, while maximizing your gains if the market performs as you anticipate, you would have a profitable strategy you could use repeatedly to generate trading income.
The Method and the Means
How, before the markets open at 9:30 Eastern time, could we have a good sense of what direction they are likely to move that day, and how big that move might be? The most obvious things are to look at the world markets overnight to see what they have done and consider signals indicative of market sentiment before the market opens. Looking at this information and quantifying it with a simple rubric can help us decide which direction the market is likely to go and how big that move is likely to be. Once we have a good sense of this, we can get more specific in our analysis of how to trade on the basis of this expectation.
World Markets
We need to start with the big picture: the world outlook in the financial markets as the day opens. While America has been sleeping, much of the rest of the world has been awake and conducting business. We want to know the direction, up or down, that the world markets have gone overnight. This information is easily obtained from CNN’s business website:
Pay particular attention to the Australian, Japanese, Hong Kong, Shanghai, Mumbai, German, French, and British markets. If these markets were up overnight, assign each of them a +1; if they were down, assign them a -1. Total all eight market contributions and divide by eight. You now have a number greater than or equal to -1 and less than or equal to +1. This is the first factor in your analysis.
Currency Markets
The next thing you’ll want to check is the world currency market to see whether the mood is bullish or bearish. It’s good to compare the exchange rates of the Australian dollar and the Japanese yen in this regard. The yen is regarded as stable and strong relative to the Australian dollar, so if the dollar is up relative to the yen on a given day, it’s a reasonable indicator that the mood is speculative and bullish, but if the currency flow is into the yen and the Australian dollar is down relative to it, the mood is bearish. You can find the relevant data here:
If the Australian dollar is up relative to the Japanese yen, assign this factor a +1; if it is down, assign it a -1. Fractional values are appropriate if the indicator is weak, or even 0 if its relatively flat. This is the second factor in your analysis.

Manufacturing, Production, and Index Futures
Next, you’ll want to check pre-market sentiment on production and manufacturing world-wide, something reasonably indicated by futures in two bellwether commodities, copper and crude oil. You’ll also want to check pre-market sentiment with respect to the composite indices you might trade during the day, something you can get a read on from the E-mini futures respectively associated with them. While this information is easily accessed on a good trading platform and in many online brokerage accounts, it also can be obtained from the following places:
Assign each of the copper, crude oil, and the index future you’re interested in trading a +1 if it is up and a -1 if it is down. Total these three indicators and multiply by two-thirds (2/3), giving you a number greater than or equal to -2 and less than or equal to +2. This is the third factor in your analysis for any given index.

Volatility and Advancing Minus Declining Stock
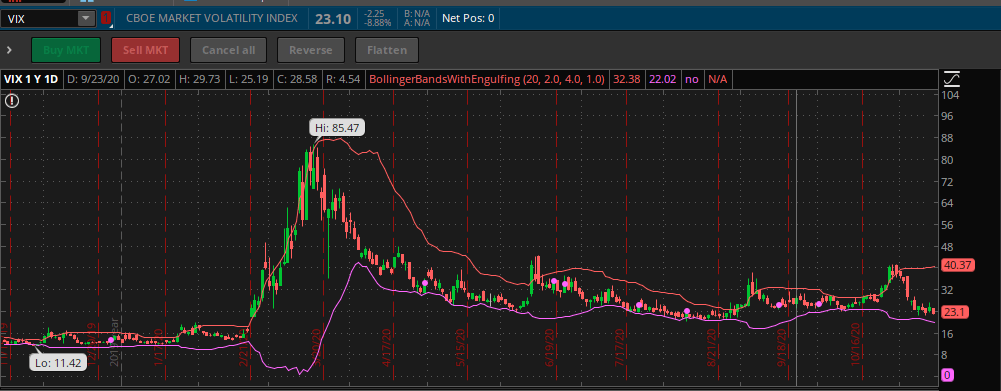
Another factor you’ll need to consider is the volatility index on the different composite indices. I’ll discuss the $VIX, which is the Chicago Board of Options Exchange (CBOE) Volatility Indicator for the S&P 500, but the CBOE has volatility indicators for the Dow, NASDAQ and Russell indices as well. What I’m going to say about the $VIX applies to all of them.
The $VIX is often called the “fear index” because it’s a good measure of market sentiment and risk. What the $VIX measures is the thirty-day implied volatility of all the options in the S&P 500 as computed from the market prices of the call and put options on the index. It represents the amount of short-term turbulence expected in the options market. The basic analysis is that when the market drops, investors want to purchase insurance, driving up the prices of put options and increasing the $VIX. Similarly, the $VIX decreases as the demand for puts decreases and the market rises. This is why, more often than not, the $VIX and the SPY have an inverse relationship: if the $VIX rises, the SPY falls, and vice-versa, though the $VIX always moves more dramatically. The crucial question is how we can use this information about the relationship between the $VIX and the SPY to assess the likely direction of the SPY on a given trading day.
Let’s start with the more common cases in which the $VIX and the SPY are moving in opposite directions, then consider the cases when they are moving in the same direction.
Opposing directions (most common):
1. Rising $VIX and Falling S&P 500
This oppositional move is a bearish signal that raises the probability for a downtrend in the S&P 500 that day.
2. Falling $VIX and Rising S&P 500
This oppositional move is a bullish signal that raises the probability for an uptrend in the S&P 500 that day.
Same direction (less common):
3. Rising $VIX and Rising S&P 500
When the $VIX and the S&P 500 are both rising, this indicates decreasing appetite for risk that significantly raises the probability of a downside reversal in the S&P 500.
4. Falling $VIX and Falling S&P 500
When the $VIX and the S&P are both falling, this indicates an increasing appetite for risk that significantly raises the probability of an upside reversal in the S&P 500.
There is one other complicating factor, namely, when the E-mini futures for other indices diverge from those of the S&P 500. When the futures for the NASDAQ, Dow, and Russell indices go in contrary directions, some up and some down, predictive reliability is compromised and it is likely that the day will deliver choppy price action, range-bound behavior, and confusion. Under these conditions, it’s a good day either for staying out the market altogether, for scalping on quick moves throughout the day, or for running a reversion to the mean (RTM) strategy. If you’re trading a small account (under $25,000) that is subject to the pattern day trading rule, you should not be scalping or day trading using RTM, though there might be swing trading strategies that are suitable.
Again, while information on the volatility indices will be available on a trading platform, it is also directly available from the CBOE:
When the $VIX is too low to be sending clear signals, it can be helpful to look at the NYSE advancing minus declining stock index ($ADD) on different time scales. The $ADD is positive if stock buying exceeds stock selling and negative if selling exceeds buying, so large positive values are bullish signals and large negative ones are bearish signals. Small values are not decisive indicators of anything. This information is available by looking for $ADD on your trading platform or directly here:
With these things in mind, the fourth factor in our analysis can be specified as follows: If the $VIX is strongly down while the S&P 500 is up, the factor is +1; if the $VIX is strongly up while the S&P is down, the factor is -1. Weaker opposing directions can be assigned fractional values. Same-direction signals should alert you to possible reversals in the market that day and the need for caution and wariness. If both the $VIX and the S&P 500 are rising, assign -0.5 for the increased likelihood of a downside reversal; if they are both falling, assign +0.5 to include the increased likelihood of an upside reversal. Similarly, a strongly positive $ADD should be assigned a +1 and a strongly negative $ADD a -1; weaker positives or negatives can be assigned fractional values accordingly. Sum the $VIX factor and the $ADD factor to give the fourth factor a weight of 2.
News and FAANG Stocks
The next thing that should concern you is the news on the day. The markets can react strongly to good news or bad news. This reaction is not necessarily rational, but if you’re focused on short-term trading profitability, you need to be aware of external factors that can shift the internal direction and momentum of the markets. For a recent example that is ongoing, news regarding the second round of economic stimulus checks has had powerful effects on the market. Anticipation of positive news on a stimulus deal drives the market up, while any news of a setback leads to a sell-off. Positive or negative news surrounding the prospects for a COVID vaccine has similar effects, though less pronounced. You should be aware of the news, earnings reports, Fed announcements, and so on, that may impact the markets as they open or throughout the day. Good places to check for market-relevant news are:
Good indicators of how the market is handling the news on any particular day are given by the FAANG stocks (Facebook, Apple, Amazon, Netflix, and Google) that are the movers and shakers in the market, especially the S&P 500 and the NASDAQ. If the volume on these stocks is light both pre-market and when it opens, the market is either not interested in the news for the day or, in all likelihood, has already factored it into its behavior. But if the volume is heavy, then the news is being taken seriously in real time, and its direction (up or down) will be a good indicator of where market momentum is headed for the day. It’s good to check these stocks about ten minutes before market open (9:20 am Eastern), a task easily accomplished on your trading platform or by searching the ticker symbol (FB, AAPL, AMZN, NFLX, GOOGL/GOOG) at https://www.marketwatch.com/.
This fifth factor can be calculated as follows: if the markets are opening higher and projected on news to edge up during the day, assign this news a +1 and also assign a +1 for each of the FAANG stocks trending higher on the day. If the markets are opening lower and projected to sink further during the day, assign a -1 to this news and then a -1 for each of the FAANG stocks trending lower. Fractional positive or negative values can be assigned to weak trends, and sideways trends given a 0. Sum these 6 factors and divide by 3 so that the fifth factor has a weight of 2.
Simple Moving Averages (SMAs)
The last factors to consider are the 5, 10, and 15 minute simple moving average (SMA) charts on the index fund you intend to trade, considered ten minutes before the market opens and fifteen minutes into the trading day. What needs to be checked is whether the 10 SMA is above or below the 20 SMA on each time frame. The daily and weekly SMA chart on the relevant index should also be consulted. This information will be available on your brokerage site or on your trading platform.
The sixth and final factor can then be calculated as follows: if the 10 SMA is above the 20 SMA on each of these time frames both before and after market open and also on the daily and weekly charts, then assign +2 to this factor. If the 10 SMA is below the 20 SMA on all these charts, then assign -2 to this factor. If the results are a mixture, then assign +1 or -1 to each of the eight components (premarket and opening market 5, 10, and 15 minute SMAs, plus daily and weekly SMAs) according to whether the 10 SMA is above or below the 20 SMA respectively, and divide the total by four to obtain the sixth factor in your analysis, which also has a weight of 2.
Rubric Roundup
Adding up the different factors in the analysis rubric, we find that it has a maximum of +10 and a minimum of -10, indicative respectively of the probability that the index ETF will gain or lose on that day. If the trader wishes to swing trade rather than day trade, the time frames of analysis should be length-adjusted accordingly.
For those operating with small accounts subject to the pattern day trading rule, it may be more advisable to swing trade. On the other hand, as long as no more than three day trades are executed within a five-day period, day trading with a small account (less than $25,000) is feasible. Focusing on three well-planned trades per week is a helpful discipline anyway, especially for novice traders, as the temptation is to overtrade and risk significant loss in equity due to fear-of-missing out (FOMO), inexperience, and mismanagement. Sitting out a market move rather than indulging an impulse trade is always a better decision. Additionally, if there is chaos and uncertainty in the news, as has accompanied the latest US election cycle even more than it normally would, it’s also a good time either not to be trading or to be trading very small positions. The markets can change quickly, unpredictably, and extensively every time the news shifts, and you don’t want the pain of being on the wrong side of a rapid move and trying to cover.
The Setup: Option Choice, Position Sizing, Entry and Exit
From the application of the rubric analysis, we’ve got a good sense of the likely broad movement—up, down, or sideways—of the markets intraday or near term, but we’re still not ready to place a trade. We need a plan for the trade and there are other decisions requiring careful consideration involving, most importantly, other indicators of when to enter the trade. It’s important that the right setup be in place in relation to your trading plan.
Our rubric analysis of the major index ETFs perhaps may leave us with a preference for trading one or other of them on a given day. Trading options on this index rather than trading shares on it offers some advantages. First, options offer a lower-cost way to go long or short in the market with greater profitability and limited downside risk. Secondly, option trading offers more flexible and complex strategies that are adaptable to profitable trading whether the market is going up, down, or sideways. It is this potential profitability and versatility that makes option trading so attractive. Of course, options expire worthless on their expiration date if they are not exercised or traded, whereas stocks can be held indefinitely, and this also should be kept in mind.
The decision to buy call options, put options, or vertical spreads, and how many contracts, should be influenced respectively by the positive or negative magnitude of the cumulative rubric figure, the strength of the entry signals we are about to discuss, and the risk comfort level of the individual trader. High rubric numbers (positive or negative) indicate the likelihood of stronger directional movements, whereas lower numbers have a correspondingly lower probability of significant movement. The things we now turn to consider are relevant not just to trading options on index ETFs, but to trading securities in general.

Before we take a trade, we need an entry signal to tell us when we should enter it, as well as support and resistance analysis, or a percentage loss tolerance, to help us manage the trade by either setting a trailing stop or a bracket order that will automatically execute as a market order when the trigger price is reached or the trade decays either for a loss or by hitting the trailing stop. The business of setting stops is trickier using options because option prices swing much more wildly than the underlying security and it’s very easy to get stopped out before profitable price moves when you’re using preset stops. If you can’t be monitoring the trade all day, however, you need to use preset stops and the best approach is to tie your stops to movements in the underlying security, not the option itself. This can be accomplished using a conditional order on a professional trading platform. The nice thing about index ETFs is that their options trade with sufficient volume that the bid-ask spread is relatively small and orders fill quickly (there is high liquidity), so pre-set stops will result in your order being filled at market prices relatively close to what you intend.
Individual trades should be limited to no more than 5-10-% of your account, regardless of your account size. You want to safeguard the money you have, not blow up your account. If you have a small account, that might mean buying just one contract on any given trade. Once your account grows to be larger, you can adjust your position size accordingly. Of course, the size of the position you adopt should also reflect the level of your confidence in the trade you are placing on the basis of your analysis before you get into it.
Whether you choose a call option, put credit spread, call debit spread, or some other option trading strategy suitable for a bull market, or a put option, call credit spread, put debit spread, or another strategy suitable in a bear market, you will need to decide which expiration date and strike price to choose. If you’re day trading, it’s OK to choose options with a closer expiration date because you’ll be out of the trade before they expire. If you’re swing trading, however, you’ll want to choose an option with an expiration date farther out, and just how far will be determined by the time frame on which you’re trading and the expected price movement.
As regards the strike price, while it may be tempting to buy cheaper out-of-the-money (OTM) options—and if the trade works out, this can be a real winner—you increase your odds of success by purchasing in-the-money (ITM) options, even though they are more expensive, because they have intrinsic value. Out-of-the-money options only have time-value and they can lose it very quickly, especially if you’re near the expiration date. It’s at this point that the Greeks, particularly the delta, are useful. The delta simply tells us how far the option price will move given a one-dollar move in the underlying stock. A delta of 1.00 means that the option price tracks the price of the stock dollar-for-dollar, whereas a delta of 0.10 means that the option price only moves ten cents for every dollar movement in the underlying stock. It’s also worth noting that the delta gives the probability that the market makers assign to the stock getting to that strike price. Out-of-the-money options have much lower deltas. On the whole, you’re better off purchasing an in-the-money option with a delta of 0.70 or better. With this in mind, the cost basis and risk of the trade can be reduced for expensive options by purchasing either ITM call debit spreads (or selling put credit spreads) as a bullish strategy or purchasing ITM put debit spreads (or selling call credit spreads) as a bearish strategy. Vertical spreads like these can be placed as one order rather than separate orders on a professional trading platform.
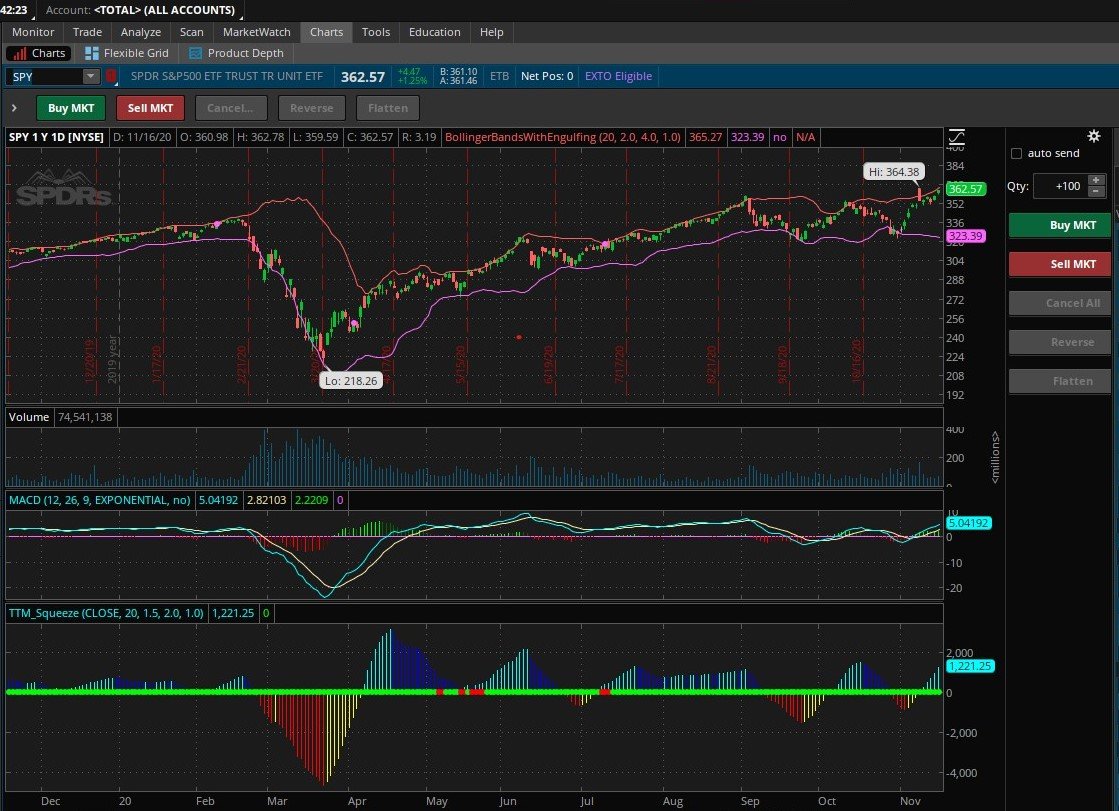
All of this said, there is an oversight in this option-pricing model that can be exploited. To this point, the market makers are pricing OTM options at any given time on the assumption that volatility will remain constant. It won’t. So we can use a volatility-based indicator, like the squeeze indicator developed by trader John Carter, to search for a setup where there is greater probability of a sharper and bigger-than-expected move than has been priced into the options market. Depending on the strength of the setup and the potential for explosive movement, it could even make sense to purchase OTM options in this situation.
Let’s examine the squeeze and take a look at a trade setup:
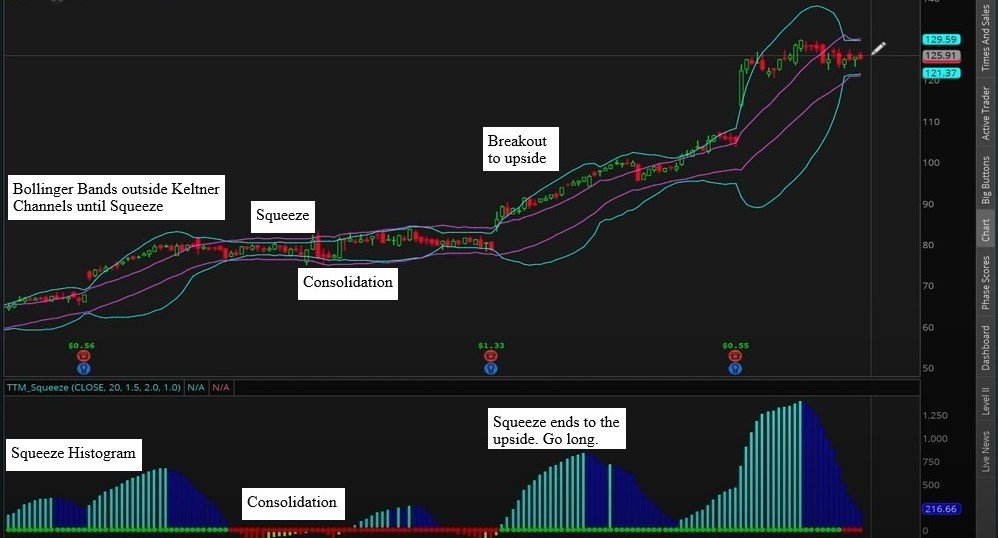
As mentioned, the squeeze is a volatility-based indicator. Bollinger Bands are a volatility indicator that is plotted as an envelope at standard deviation levels above and below a moving average of the price of a security. Which moving average? The 21-period moving average is a standard one to use. The bands widen when volatility increases and narrow when it decreases. The Keltner Channels make an envelope around the moving average on the same time frame based on the maximum and minimum of the average true range (ATR) of the security’s price. The ATR gives the average price over the previous fourteen periods of the time frame on which the analysis is being done. The Keltner Channels stay in a relatively steady range while the Bollinger Bands do not, varying instead with market volatility. A squeeze happens when volatility subsides to the point that the Bollinger Bands move inside the Keltner Channels and a trade signal is generated when the Bollinger Bands break out of the Keltner Channels on rising volatility. When this happens the squeeze histogram will indicate whether it is to the upside or the downside, indicative respectively of whether you should trade options to the long or the short side. The red dots on the axis of the histogram indicate that the security is in a sideways movement, squeezing out the last bit of consolidation before building up momentum for a break to the upside or the downside. When the dots turn green, volatility has broken loose from the Keltner Channels and is being released in the direction indicated by the histogram.
Ideally, the trader wants to get in right before the big move that happens when the squeeze releases, rather than end up chasing it. Are there any indicators that will help do this? Yes. Underneath a candlestick chart with the Bollinger Bands and Keltner Channels plotted, in addition to the squeeze histogram indicator, you can stack the average directional index (ADX) indicator and the wave indicator. These indicators are generally available on professional trading platforms and are certainly available on both thinkorswim (TOS) and TradeStation (TS). The ADX indicator quantifies the strength, but not the direction, of the trend being released. It ranges from 0 to 100 and relatively strong trends worth trading should have values over 25. The wave indicator, developed by trader Rodney Julian, gives an early directional signal of the trend and also an anchor for judging whether it’s a false short-lived signal or more likely a long-term trend that’s not going to go against you. It consists of three trend “waves” of increasingly longer period (A-, B-, and C-waves, respectively) calculated, roughly, from the preceding six, fifteen, and thirty periods on which the trade is being analyzed. The C-wave is the most important wave indicator because it will tell you when a longer-term trend that is unlikely to reverse quickly is in place.
Ideally also, the trader wants to get into the trade at a good price, so there’s another consideration that should be brought to bear. A good entry point is critical for a squeeze trade. If the price is too far off its moving averages, then it may come down before the squeeze fires, so it is wise to check whether the current price is still between the 8 and 21 period exponential moving average (EMA). If it is, you’re good to go; if it isn’t, wait. Patience and calmness are indispensable virtues when trading.
Another method for assessing entry would be to examine whether a squeeze is forming on multiple time frames. For example if you have a bullish squeeze on 15-minute chart, it will be much more reliable if there are bullish squeezes forming on the 30-minute, hourly, and daily charts as well. This, along with checking whether the stock price is between the 8 and 21 period EMAs, also provides reliable information for entering a trade. If both assessments lead to the same conclusion, you’re in like Flynn.
A professional trading platform enables you to select any of these kinds of analyses and search in real time for stocks that satisfy them.
The strategy is implemented as follows: when the ADX is really low during a squeeze, there is a high probability that volatility is going to fire off in a pronounced way in the direction of the trend indicated by the C-wave. If the squeeze has been in place for a few periods, it is a good strategy to enter a trade in the direction indicated by the C-wave before the squeeze fires. This is all-the-better if a squeeze is forming on multiple time frames. A short presentation of this strategy is explained by John Carter here: https://www.simplertrading.com/squeeze/.
Now that you’re in the trade, when do you exit? If you’re aren’t able to monitor the trade, you should use stops. As already mentioned, for option trades you should base your stops on the behavior of the underlying security. As also noted in this regard, the advantage of trading options on index ETFs is that there’s a small bid-ask spread in a highly liquid option market, so your stop, when triggered, should fill in the neighborhood of the price you ask. If you’re using a preset bracket order, you should condition your stops based on support and resistance in the underlying security. If you use this strategy, however, when a squeeze fires off in your favor, there’s a good chance it will blow through a conservative price point for profit taking and you’ll leave some of the profit on the table. But you’ve still made money, so be happy. The other method would be to use a conditional order on the underlying stock with a trailing stop such that, when the momentum reverses and the stock price starts to fall, you’ll get stopped out at a specified dollar difference or percentage difference below the high point of the movement.
If you’re able to monitor the trade, however, you should certainly exit when the trade starts to lose momentum, as indicated when the squeeze histogram reverses direction, or scale out based on the expansion of the average true range induced by the strong directional move in the stock. John Carter, for instance, recommends taking off one-quarter of the position for every multiple of the ATR that the trade is up, so that you’re three-quarters out after the trade exceeds three times the original ATR. The remaining quarter is then held until the momentum reverses.
A Summary
In review, then, here is the trading strategy:
(1) Use the rubric analysis to determine whether the overall market is bullish or bearish and to what degree. If it’s an ambiguous kind of day, stay away from trading the market indices and choose a trending stock instead, or use a more sophisticated option strategy designed for sideways markets based on reversion to the mean, or on more sophisticated option plays we haven’t discussed.
(2) Are the SPY, QQQ, DIA, and IWM bullish, bearish, or choppy on the rubric SMAs and are they all behaving the same way? What about the top sector ETFs like XLB (raw materials), XLC (communications), XLF (financial), XLI (industrial), XLU (utilities), XLV (healthcare), VDC (consumer staples), VDE (energy), VNQ (real estate), VCR (consumer discretionary), and VGT (information technology)? If you’re trying to set up for a squeeze play, choppy markets are no good. Again, if you’re looking to trade a sideways oscillating market, consider a reversion to the mean strategy or a more sophisticated option strategy. If you only wanting to use the strategy discussed here, however, you should take a pass on choppy markets.
(3) Is one of the index ETFs consolidating in squeeze mode with the Bollinger Bands inside the Keltner Channels? This is the preparatory signal you want to see. It’s even better if it’s happening on multiple time frames.
(4) Is the ADX low during the squeeze (well under 20) and does the C-wave provide a long-term anchor for a shorter-term squeeze?
(5) Is the price of the stock between the 8 and 21 EMAs?
(6) If all these conditions are satisfied, enter the trade!
(7) Get your exit strategy in place by either: (a) monitoring the trade in accordance with your plan to exit when the momentum reverses, or to scale out on multiples of the ATR; or (b) set a conditional bracket order with stops just outside judiciously-chosen earlier support and resistance in the underlying security, or use a conditional order with a trailing stop based in the underlying security.
(8) Follow Bobby McFerrin’s advice, based on Bob Marley’s advice: Don’t Worry! Be Happy!
Final Caveats
In conclusion, let me emphasize some trading truths in case you don’t already know them. Trading is all about managing your risk and letting the profits take care of themselves. So:
(1) Refuse to enter a trade unless it satisfies the conditions of a well-defined setup that gives you an edge. An edge is simply the higher probability of one trade outcome rather than another. An edge is not a guarantee. Trade based on reasons, not emotions. Trade decisions based on feelings will lose money on a regular basis. If you don’t have the right setup, you don’t trade. Period.
(2) Make sure you’re not risking more than 5-10% of your account on any given trade and that you’re not ever risking more than you’re willing to lose. If you’re not willing to lose 5%, then risk less. If you’re new to the trading game, trade small to start.
(3) Plan your exit strategy and know where you will exit in the case that things go wrong as well as in the case where they go right. Stick to these pre-defined levels. Ignoring your stops will lose you money much more often than it will gain you money.
(4) Don’t try to manage too many trades simultaneously—you will miss something and mess up! It is better to trade less and do so meticulously than to trade a lot and make unnecessary mistakes. It’s impossible to trade all of the opportunities that present themselves and it is a mistake to try. Let go of FOMO: the fear of missing out will be your ruin, so don’t trade more positions than you can properly manage.
(5) Make sure that you don’t have more than 20% of your trading account tied up in short-term trades. Longer-window trading that is more investment-style and focused on stocks and bonds is suitable for up to 50% of your portfolio, but keep your day and swing trading portfolio under tight wraps. It is also a good idea to diversify over financial sectors and option trading strategies,
(6) Remember that, where the markets are concerned, anything can happen, and while you don’t need to know what’s going to happen in order to make money, you will sometimes lose money. It’s inevitable. And that’s OK if you’ve managed your losses properly. You must cut your losers mercilessly, and let your winners run with a well-defined exit plan.
Beyond this, if you’re really new to trading, the first thing you need to do is learn your chosen trading platform. The first time you sit down to take a look at it, it can seem like the cockpit of the space shuttle. But if you take it slowly and systematically, you can learn how to find your way around and tailor its appearance to your emerging style of trading. It’s also very helpful to paper trade (trade on a simulator) for a while to make sure you understand the order entry process, how to use your chosen indicators, how to set your stops, and so on. Most good trading platforms come with a simulated trading feature—thinkorswim and TradeStation certainly do. All this takes time and effort, but it pays off. You need to respect the learning curve or it will turn around and bite you. Trade small to start and manage your risks with preset stops.
As a final note, if this is not obvious, let me issue a disclaimer. I am not registered as a securities broker-dealer nor am I an investment adviser. I am an independent private trader and investor who has no formal qualifications to offer investment advice. I am giving you information about what I find helpful in my own private trading. Where trading and investments are concerned, you are responsible for doing your own research. If you decide to try any of the strategies I have discussed, you do so on your own initiative and at your own risk, so be careful: the markets eat alive the naive and unprepared.
Welcome to the hunger games. May the odds be ever in your favor!
The Terminology
Ask: The price that the market makers and traders on the exchanges ask you to pay for a stock or option contract or another financial instrument.
At-the Money (ATM): The strike price of an option contract at the currently traded value of the underlying security.
Average Directional Index (ADX): The Average Directional Index (ADX) is an indicator used to quantify trend strength so the trader can know when a price is trending strongly. It ranges from zero to one-hundred, but is non-directional and merely measures the strength of the trend regardless of whether it is up or down. It can be paired helpfully with the TTM Squeeze and TTM Wave indicators. All of these are available on the trading platform that comes comes with a TD Ameritrade account (thinkorswim) or on the TradeStation trading platform.
Average True Range (ATR): The average true range (ATR) is the average price of a security for the prior 14 periods of trading (the length of the periods can be adjusted to various time-frames).
Bar Chart: A bar chart plots the open, high, low, and close (OHLC) for each time period using bars. Bar charts tend to look cluttered, so most traders prefer candlestick charts that present the same information in a more visually appealing and easily interpreted format.
Bear Market: A market in which prices are falling over an extended period of time.
Bearish Signals: Technical indicators that the price of a security is going to drop in price or that the markets themselves are headed down and that a short position should be adopted on the time frame in question.
Bid: The price that the market makers and traders on the exchanges will bid to purchase a stock or option contract or another financial instrument.
Bid-Ask Spread: The difference between the bid and ask prices. The ask is always higher than the bid.
Bollinger Bands: Bollinger bands are a technical analysis tool invented by John Bollinger. They plot trendlines two standard deviations above and below the simple moving average (SMA) of the price of a security. Bollinger noticed that sharp price changes tend to occur after volatility lessens and the bands tighten. When prices move outside the bands, a continuation of that trend (in whatever direction) is likely. Bottoms and tops of movement outside the bands followed by bottoms and tops made inside the bands indicate a likely trend reversal and can be a basis for a reversion to the mean strategy. Finally, a directional move originating at one band tends to move to the other band, an observation that is useful in setting price targets in a trade.
Bonds: Bonds are debt obligations that pay periodic interest at a fixed rate and promise repayment of the principal at maturity. Buying a bond is comparable to providing a loan at a fixed rate of interest with the principal due back at the end of the loan period. Since they are regarded as low-risk, bonds tend to rise in price when stocks fall, though this can be affected by other factors, like the interest rate. Really low interest rates or low inflation, like we’ve had for a while now, can result in stocks and bonds moving in the same direction.
Bracket Order: A bracket order places an OCO (one-cancels-other) “take profit” and stop order once a position is opened: (a) if a long position is entered, a bracket order will immediately place an OCO sell limit (take profit) and sell stop; (b) if a short position is entered, a bracket order will place an OCO buy limit (take profit) and buy stop.
Brokerage: A company that buys or sells securities on behalf of clients who have an account with them.
Bull Market:A market in which prices are rising over an extended period of time.
Bullish Signals: Technical indicators that the price of a security is going to rise in price or that the markets themselves are headed up and that a long position should be adopted on the time frame in question.
Call Credit Spread: A call credit spread, also known as a bear call spread or short call spread, is a bearish vertical spread strategy in which the premium payed for the option purchased at a higher strike price is less than the premium received for the option sold at a lower strike price. Income is less than if you’d just sold an uncovered call, but you’re covered if the stock moves upward against you. If the stock drops to the lower strike price, as you hope, you wait for expiration and keep the difference in the premiums. Profit potential obviously increases with the number of contracts and is maximized if you keep the full amount of the net credit received on opening the position; your maximum potential loss is limited to the difference between the strike positions minus the net credit received.
Call Debit Spread: A call debit spread, also known as a bull call spread or a long call spread, is a net debit spread using only calls where the trader buys a lower strike call and sells a higher strike call. The lower strike has a higher price, so there is a net debit to the trader’s account. Call debit spreads have a limited risk and reward and are more profitable as the underlying security rises to the higher strike price. The maximum loss is the net debit paid and the maximum gain is the difference between the strike prices minus the net debit paid.
Call Options: For every call option purchased, you acquire the right, but not the obligation, to buy 100 shares of the underlying security at the strike price before the expiration date. For every call option sold, you acquire the obligation to provide 100 shares of the underlying security at the strike price before the expiration date if called upon to do so (the stock is “called away” from you). At any time before expiration, of course, you can sell to close a call you’ve purchased or buy to close a close a call you’ve sold.
Candlestick Chart: Candlestick charts display the open, high, low, and close prices in a format similar to that of bar charts. They can be used to analyze stock behavior over any time period, but they do not involve any calculation.
Charts: A stock chart is simply a price chart that shows a stock’s price plotted over a time frame, displaying important information about its movement. The three basic kinds of chart used are line charts, bar charts, and candlestick charts.
Chicago Board of Options Exchange (CBOE): The CBOE is a registered exchange on which stock options are traded. It was the first such exchange and is the largest in the world.
Composite Indices: A composite index is a statistical tool grouping together different securities to create an aggregate representation of the overall performance of the market or of a certain sector of the market. Composite indices are used for investment analysis, the discernment and measure of economic trends, and the forecast of market activity. It is usually the goal of private investment portfolios to generate returns that exceed those of the major composite indices—the NASDAQ composite, the Dow, the S&P 500, and various of the Russell Indexes.
Conditional Order: Conditional orders are: (1) orders that are filled when certain conditions are satisfied; or (2) the filling of which triggers a condition for another order.
Contract: A contract is a unit of trading for options or futures. Each contract is for 100 shares of the underlying security.
Credit Spreads: Credit spreads are an options trading strategy in which you simultaneous buy and sell options that are either both calls or both puts and have the same expiration date, but with different strike prices. Since you are selling the option at a higher price than you are buying it, the premium you receive creates a net credit in your trading account. See call credit spreads and put credit spreads.
Day Trading: The acquisition and disposal of a security on the same day.
Debit Spreads: Debit spreads are an options trading strategy in which you simultaneous buy and sell options that are either both calls or both puts and have the same expiration date, but with different strike prices. Since you are buying the option at a higher price than you are selling it, the there is a net debit in your trading account. See call debit spreads and put debit spreads.
Delta: The amount that the price of an option premium moves per dollar movement in the underlying security and the probability that the market makers assign to the security reaching that strike price.
Derivative: A derivative is a financial instrument whose value is derived in some sense from the value of an underlying asset. Options and futures are examples of derivatives.
Downside Reversal: A change in the direction of the price of a security from rising to falling.
E-mini Futures: An e-mini future is an electronically traded futures contract that only costs a fraction of the value of the corresponding standard futures contract. E-mini futures are traded on the Chicago Mercantile Exchange (CME) and exist for a wide range of indices, commodities, and currencies. The very first e-mini contract was based on the S&P 500 and began trading in September 1997. It was valued at one-fifth the price of the full-sized contract.
Entry: The initiation of a trade or the price at which a trade is initiated. See exit.
Exchange Traded Funds (ETFs): An exchange-traded fund (ETF) is mutual fund, that is, a collection of securities that may consist of stocks, bonds, commodities, real estate, or other financial assets, which trades on an exchange just like a stock does. By design, ETFs offer more liquidity and trading flexibility than other investment vehicles since they are bought and sold on an exchange, much like individual stocks, where supply and demand continually dictate share prices. Investors can make trades during normal market hours in response to changing market conditions and expectations.
Exercise: The activation of the right to buy or sell the underlying security due to the option having reached or surpassed the strike price (exercise price).
Exit: The conclusion of a trade or the price at which a trade is ended. See entry.
Exit Strategy: The strategy used by a trader to bring a trade to a conclusion. Wise traders have this strategy planned as part of the setup before they enter a trade and have already decided the price points and method by which they will take profits if the trade is favorable and by which they will cut losses if the trade goes against them.
Expiration Date: The date on which your ability to exercise an option ceases. After this time it is worthless.
Exponential Moving Average (EMA):The exponential moving average (EMA) is a weighted moving average that gives greater significance (weight) to the most recent prices. As a technical indicator, it can be used to produce buy and sell signals based on crossovers or divergences from simple moving averages.
Extrinsic Value: The value of an out-of-the-money (OTM) option is wholly extrinsic and consists entirely of time-value (time premium).
FAANG stocks: “FAANG” is an acronym for the five most popular and best-performing technology stocks: Facebook, Apple, Amazon, Netflix, and Google (now known as Alphabet). These five companies are among the largest in the world, with a combined market capitalization of over $4.1 trillion dollars as of January 2020. Their performance each day has a huge influence on the direction of the overall market.
Fundamental Analysis: Analysis of a company’s stock based on its ability to generate profits for its shareholders. This kind of analysis focuses on earnings, P/E ratios, earnings per share, net assets, liabilities, customer base, and so on.
Futures: A futures contract requires a buyer to purchase shares (and a seller to sell them) on a specific future date unless the holder’s position is closed before the expiration date.
Greeks: The Greeks are derived from options and represent various ways that option prices change in relation to the underlying security. The main Greeks are as follows: delta measures the percentage that option premiums change per dollar change in the underlying security; gamma measures the expected change in delta accompanying a price change in the underlying security; theta expresses the rate of change between the option price and time and represents the option’s time decay; vega expresses the option price’s rate of change relative to changes in its implied volatility; and rho represents the rate of change between an option’s value and a 1% change in the interest rate.
Implied Volatility: The implied volatility of an option is closely related to the supply and demand for it. An option in high demand relative to the available supply normally rises in price while one in low-demand falls in price and this induces corresponding movements in option premiums. Nonetheless, the relationship between implied volatility and the price of the underlying asset is tenuous, so implied volatility is not a predictor of price movements in the underlying security itself. Generally speaking, in a bullish market, calls will have a higher implied volatility and puts a lower implied volatility, with the situation being reversed in a bear market. Implied volatility can change very quickly without any change in the actual volatility of the underlying security or even of the option itself. It gives expression to the perceived likelihood of a price swing, without predicting whether it will be up or down. Nonetheless, it is often the case that implied volatility has an inverse relationship to the direction of the market, rising in bear markets and falling in bullish ones, since bear markets are undesirable to long-term investors and considered more uncertain and risky. Another factor that influences implied volatility and option premiums is the time-value of the option. A near-dated expiration often results in low implied volatility, whereas an expiration date farther away has a relatively higher implied volatility, since over a longer period of time the price is perceived to have a greater probability of a larger movement than over a short period of time. Vega, as the Greek that measures implied volatility, is greatest when the time-value of the option is greatest and least when it is least. Since the time premium is greatest when the value of the option is at-the-money, this is also when implied volatility has the greatest effect on the price of the option. Time-value and vega both decrease as an option moves further in-the-money or out-of-the-money.
Index ETF: An index ETF is an exchange traded fund that is based on a market index. Two of the most popular ETFs are the S&P 500 SPDR (SPY) and the Powershares QQQ Trust (QQQ), the former (obviously) tracking the S&P 500 and the latter tracking the NASDAQ 100 index. These ETFs allow you to trade shares on the underlying indices either directly or through options.
In-the-Money (ITM): An in-the-money (ITM) option can be exercised for a profit. A call is ITM when the current stock price exceeds the strike price; a put is ITM when the current stock price is less than the strike price.
Intrinsic Value: The amount by which an option contract is in-the-money (ITM).
Investing: As contrasted with trading, investing is the long-term holding of a security in the hope that it will increase in value or provide a reliable source of income during the period for which you hold it.
Keltner Channel: Keltner Channels plot outer bands on the price movement as positive and negative multiples of the average true range (ATR) on the relevant time frame. In setting up a squeeze, in which the Bollinger Bands contract so they are inside the Keltner Channels, setting the upper and lower bands at 1.5 times the current ATR from the mean price of the range is common.
Large-Cap Stocks: Large-cap stocks are stocks of companies whose total value of shares in the market exceeds $10 billion.
Legging In and Legging Out: A leg is one side or component of a spread trade. Legging into a spread involves completing just one component of the trade with the intention of completing other parts of it at a later time when prices are more favorable. Legging out of a spread is the opposite, namely, exiting the spread one component at a time with the intention of completing the other components at more favorable prices as the security continues to move in the direction that was anticipated.
Line Chart: A line chart is a simple linear presentation of the price behavior of a stock over a given time period.
Long: Being long means that you are the buyer of a security.
Margin: An amount, either in cash or marginable securities, that is paid by a brokerage account holder to the brokerage for holding against noncash or high-risk trading or investment instruments, or where the brokerage has loaned the account holder the means to undertake a given trade.
Margin Account: A margin account is one in which the trader may borrow from the brokerage in order to make a trade, that is, an account where the brokerage lends the trader part of the net debit required to make a trade.
Margin Call: A margin call happens when the brokerage contacts the trader to inform them that more funds need to be placed in their account to maintain a current trade. Levels of margin for trades involving unlimited risk are determined by the policies of the brokerage.
Market Index: A market index provides a broad representative portfolio of investment holdings involving weighted averages of securities that are then used as benchmarks for measuring the movement and performance of market sectors or individual companies. These indices are useful for judging the performance of investment portfolios. See Stock Index.
Market Makers: Traders buying and selling securities in accordance with supply and demand or a firm that buys and sells securities in a market in order to facilitate trading. Market makers create a two-sided (bid and ask) market.
Market Order: A market order is a trader’s instruction to a broker to sell or buy a tradable asset at the best available price at the time the order is received.
Mid-Cap Stocks: Mid-cap stocks are stocks of companies whose total value of shares in the market lies between $2 billion and $10 billion.
Momentum: The momentum of a tradable instrument is the velocity of its price changes. The rate of change of price movement over time is an important indicator of the strength of a trend and used as a basis for trading that stock. Stocks that have a history of moving with strength of momentum are called momentum stocks.
OCO Order: A one-cancels-other (OCO) order is a conditional order in which two orders are placed, and one order is canceled when the other order is filled.
Options: An option is a financial derivative that gives the buyer the right, but not the obligation, to buy (call) or sell (put) 100 shares per contract of the underlying security at a strike price before an expiration date. Similarly, an option seller acquires the obligation to sell (call) or buy (put) 100 shares per contract of the underlying security if the underlying security is at-the-money or in-the-money at expiration.
Option Trading: Option trading is the trading of options contracts rather than the trading of the underlying stock. The advantage to this is that options are leveraged by giving the trader control over 100 shares of the underlying security at a much lower cost than the purchase of those shares, so the magnitude of the price movement in the derivative market is very large in comparison to the price movement in the underlying stock. This allows for much greater profitability and also, of course, for much greater loss.
Out-of-the Money (OTM): Out-of-the-money (OTM) options have no intrinsic value and cannot be exercised for profit. A call option is OTM if the current stock price is less than the strike price of the call; a put option is OTM if the current stock price is greater than the strike price of the put.
Paper Trading: Paper trading is simulated trading that allows a trader to practice buying and selling without risking real money. A variety of trading platforms offer paper trading simulators using real-time stock market data.
Pattern Day Trading Rule: A pattern day trader is one who makes four or more day trades within five business days in the same account. If you are identified as a pattern day trader, you are subject to additional regulatory scrutiny and limitations. In particular, the pattern day trading rule requires traders to hold at least $25,000 in their margin accounts if they are to continue day trading. If the account balance drops below $25,000, they will be prohibited from making further day trades for 90 days or until the account balance is brought back up over the required minimum. Positions entered late one day and exited the following trading day do not count as day trades.
Portfolio: A portfolio is a collection of financial investments like stocks, bonds, commodities, cash, and cash equivalents, held by an investor. It can also include real estate, art, and various other assets. A portfolio can be managed by the investor themselves or this task can be delegated to a financial advisor, money manager, or investment firm.
Position Size: The position size can simply be the number of shares or option contracts bought or sold in a given trade, but it can also be measured in terms of the percentage of your account involved in a given trade. Generally speaking, you should size your position in any given trade so that it does not exceed more than 5-10% of your account.
Premium: The amount paid to purchase an options or futures contract or received from selling such a contract.
Premium Decay: Premium decay is another term for time decay or time-premium decay. See time decay below.
Put Options: For every put option purchased, you acquire the right, but not the obligation, to sell 100 shares of the underlying security at the strike price before the expiration date. For every put option sold, you acquire the obligation to buy 100 shares of the underlying security at the strike price at the expiration date, when the stock will be “put” to you. At any time before expiration, of course, you can sell to close a put you own or buy to close a put you’ve sold.
Put Credit Spread: A put credit spread, also known as a bull put spread or a short put spread, is a net credit spread using only puts in which the trader buys a less valuable lower strike put and sells a more valuable higher strike put. Put credit spreads have limited risk and reward and become more profitable as the underlying asset rises to the higher strike price. The maximum potential gain is limited to the net credit received on opening the play, and the maximum potential loss is limited to the difference between the strikes, minus the net credit received.
Put Debit Spread: A put debit spread, also known as a bear put spread or a long put spread, is a net debit spread using only puts where the trader buys a higher strike put that is more expensive and sells a lower strike put that is less expensive for a net debit. Put debit spreads have limited risk and reward and are more profitable as the underlying asset falls to the lower strike price. The maximum risk is limited to the net debit paid and the maximum potential profit is the difference between the strikes minus the net debit paid.
Resistance: The resistance, or resistance level, for an asset is a price that it has not risen above over a given time period. The resistance level can be visualized on a price chart by drawing a line that connects the highest highs over the time period in question. A more dynamic view of resistance can be had by adding trend lines and moving averages to the chart picture. See support.
Reversion to the Mean (RTM): A lot of the time, stocks oscillate sideways around the mean of their average true range (ATR), which indicates that a reversion to the mean (RTM) strategy is frequently going to be successful. The only time it won’t is when there’s a squeeze, the release of which, with high probability, will send the stock soaring or plummeting out of its original ATR with directional momentum. If you set Keltner Channel bands at 1.5 times the ATR, or use Bollinger Bands, you can trade an RTM strategy by directly shorting the stock or buying puts on a pullback from the upper band, knowing that there is a high probability it will revert downward to the mean, or by buying the stock directly or purchasing calls on a pullback from the lower band, knowing it’s highly probable that it will revert upward to the mean. In either case, you close out the position when the movement starts to reverse, opening a new trade with the opposite position. You can do this whole cycle over and over again as long as the sideways trend continues. Wash, rinse, repeat.
Scalping: Scalping involves buying and selling assets, typically with a brief holding time and with multiple trades taken each day, with the goal of keeping risk small and capturing small price movements for a profit using leverage and large position sizes. More often than not, scalpers buy and sell currencies in various-sized lots in the foreign exchange (forex) market or they trade e-mini S&Ps or mini-sized DOWs because the volume is huge and liquidity is high, so the bid-ask spread is small and trades are executed immediately, which is indispensable for successful scalping.
Setup: A trade setup consists of the basic conditions, decided in advance as part of a trader’s trading plan, under which a trader will consider placing a trade. In the context of trading options on index ETFs using the strategy under current discussion, the setup is defined by there being a high probability of market motion either up or down on the basis of pre-market and opening market rubric analysis, the presence of a squeeze firing off on the relevant time frame (and even better, on multiple time frames) in the same direction as the rubric analysis as a signal to enter the trade, the choice of option and expiration date, an acceptable contract price for the entry point, and the size of the position to be taken. The trade should then be managed either: (1) with stop-loss orders placed just under a recent low of the underlying security if the motion is upward (and just over a recent high if the motion is downward), with a plan to exit the trade and take profits when momentum begins to reverse; or (2) a bracket order that sets a stop-loss and a pre-determined profit target as an OCO order or uses a trailing stop based on a specific dollar drop or percentage drop below the high-point of the trade; or (3) if vertical spreads have been traded, waiting for expiration if the trade continues in your favor or legging out of the positions if it starts to go against you.
Short: Being short on a security means that you are selling shares on margin borrowed from the brokerage when you do not own them. You will later have to buy them back, hopefully at a lower price, thus making a profit.
Short Float: The percentage of shorted shares of a stock in relation to the number of shares currently available for trading. If the percentage is high, then a move upward in the stock will trigger purchase of the stock as traders seek to cover their short position and limit their losses, resulting in a rapid rise in the price of the stock.
Simple Moving Average (SMA): A simple moving average (SMA) computes the average of prices over a selected time range for a tradable instrument—usually its closing prices—by dividing the sum of the prices for each period in the range by the number of periods in that range.
Small-Cap Stocks: Small-cap stocks are stocks of companies whose total value of shares in the market lies between $300 million and $2 billion.
Squeeze: A squeeze is a volatility-based trading signal invented by the trader John Carter. Bollinger Bands form a channel enveloping a moving average of the price of a security at standard deviation levels above and below it. They widen during periods of high volatility and narrow during low volatility in sideways markets. Keltner Channels form a similar envelope based on a moving average and the associated average true range (ATR), the channel bands being offset from the central moving average by a positive and negative value based on the ATR. Keltner Channels stay in a relatively constant range, while Bollinger Bands expand and contract with the volatility. A squeeze happens when the Bollinger Bands contract to be inside the Keltner Channels, signaling that the price of a security is taking a rest and building up for its next move. The trade signal occurs when the Bollinger Bands break outside the Keltner channels on momentum. For Carter’s TTM squeeze indicator, this information is presented as a histogram which can be displayed under the candlestick chart with overlaid Bollinger Bands and Keltner Channels on your trading platform. The direction in which the squeeze histogram fires when the Bollinger Bands break out of the Keltner Channels is a signal for whether to go long or short. If the histogram is above zero when the squeeze ends, it is a signal to go long; if it is below zero, it is a signal to go short. The formation of a squeeze signal can be checked on multiple time frames for added confirmation. A more extensive introduction to the squeeze can be found here: https://intercom.help/simpler-trading/en/articles/3263889. The squeeze also can be paired helpfully with the average directional index (ADX) and TTM wave indicators. All of these indicators are available on standard professional trading platforms like thinkorswim or TradeStation.
Standard Deviation: In technical analysis, standard deviation functions as a statistical measure of volatility and is used as a component of other indicators like Bollinger Bands. The standard deviation is calculated by taking an n-period simple moving average (SMA) of the security (giving equal weight to the closing price for each of the n periods), summing over the squares of the difference between the closing price of each period and its moving average over each of the preceding n periods, dividing this sum by n, then taking the square root of the result.
Stochastic Oscillator: A stochastic oscillator is a technical indicator of momentum that compares a selected closing price of a security to a range of its prices over a given period of time. The oscillator’s sensitivity to market movements can be adjusted by changing the time frame being measured and is reduced by taking the moving average of the result. The stochastic oscillator is useful for generating overbought or oversold signals on a security that indicate a higher probability of reversal in its price movement.
Stochastic Momentum Index (SMI) Histogram: The stochastic momentum index (SMI) is more sensitive than the stochastic oscillator because it uses a wider range of values and has a higher sensitivity to closing prices. The SMI is a calculation of the distance of the current closing price above or below the median of the high/low range of the price over a specified period. The SMI has a normal range of values between -100 and +100, yielding positive values when the current closing price is higher than the median and negative values when it is lower. The SMI is often used as a trend indicator, with values over +40 being interpreted to indicate a bullish trend, and values below -40 indicating a bearish trend. The SMI Histogram is the difference between the SMI and the moving average signal line applied to it, and it is used to track changes in the direction of the SMI. Tracking the trend direction with the histogram, one would take the histogram crossing above the zero line as a buy signal and crossing below it as a sell signal. Combining it with a volume indicator and a squeeze indicator provides a powerful entry or exit signal for trades with significant buying or selling pressure.
Stock Index: A stock index measures the aggregate price performance of a collection of securities over time using a standardized metric and methodology. These indices are most commonly used as standards against which to evaluate the performance of an investment, though index investing has also become a popular way of matching their performance. See Market Index.
Stop-Loss: If a trader is long or short on a security, stop-loss orders specify that owned shares be sold if the stock drops to the price specified as the stop price, or that sold shares be bought back if they rise to the pre-specified stop price, so as to end losses on the trade. Once the stop price is reached, the stop order becomes a market order and is executed at the best available price at the next opportunity. Stop-loss orders are used by traders to prevent losses when share prices drop and they are long in the security or when share prices rise and they are short the security. See trailing stop; market order; conditional order; bracket order; and OCO order.
Strike Price: The price at which a security may be bought or sold by the owner of a call or put option. Also known as the exercise price.
Support: The support or support level for an asset is a price that it has not fallen below over a given time period. The support level can be visualized on a price chart by drawing a line that connects the lowest lows over the time period in question. A more dynamic view of support can be had by adding trend lines and moving averages to the chart picture. See resistance.
Swing Trading: Swing traders look to capture short- to medium-term gains in stocks or options over periods ranging from a couple days to a couple months. The primary tool of a swing trader, as with a day trader, is technical analysis, but swing traders may also find utility in fundamental analysis in predicting trends and patterns for longer-held trades.
Technical Analysis: Technical analysis uses chart patterns and indicators (prices, volumes, moving averages, stochastics, and so on) to predict price movements on various time scales.
Time Decay: Also sometimes simply called premium decay, time decay is the rate that an option’s price changes as it approaches expiration. Time decay is slow when there is a lot of time left until expiration, but it accelerates the closer it gets to the expiration date. Time decay also goes much faster for out-of-the-money (OTM) options, which is why professional traders, apart from special situations, prefer to buy in-the-money (ITM) calls and puts even though they’re more expensive.
Time-Value: The price of an option minus its intrinsic value. The value of out-of-the-money options is composed entirely of time-value (also known as time-premium or extrinsic value) and is calculated on the basis of the time remaining until the expiration date.
Trading Plan: A trading plan is a well-considered systematic method for identifying setups and trading securities. It involves considering a variety of factors, including timing, risk, and the objectives of the trader. No trades should be pursued without a well-researched plan—trading on impulse is a recipe for losing money. A basic trading plan looks for specific setups based on entry and exit rules and considers how risk is to be managed and positions are to be sized relative to the size of the trading account. Traders may also have discretionary rules governing when and how they trade.
Trading Platform: A trading platform is a software package used for trading securities. It allows you to open, close, and manage market positions through an online broker. Kinds of platforms can range from the basic order entry screens used by beginners to professional platforms with complex analytical tools and live streaming quotes. Online brokers frequently offer their own trading platforms in exchange for maintaining a funded account or for making a minimum number of trades per month. Option traders frequently use either TD Ameritrade’s thinkorswim (TOS) platform (https://www.tdameritrade.com/tools-and-platforms/thinkorswim/desktop.page), the TradeStation (TS) platform (https://www.tradestation.com/), or more recently, the tastyworks (TW) platform (https://tastyworks.com/), which specializes in option trading.
Trailing Stop: A trailing stop is a stop-loss order where the stop price is not fixed at an absolute dollar amount, but rather trails the trade in whatever direction it moves, being set at a fixed dollar amount or percentage below the market price for long positions, or a fixed dollar amount or percentage above the market price for short positions, and triggering if there is a movement by that dollar amount or percentage against the greatest profitability of the trade up to that point. Here is an example of how it would work for a long position: when the price increases, the trailing stop rises along with it at the specified distance, for example, a dollar a share below the market price, or perhaps 5% below the market price, if you’re keeping a fairly tight stop. Because the stop price has risen along with the security itself, profits are locked in as long as new highs are reached. Trailing stops can be used with stocks, options, and futures on any professional trading platform and in many brokerage accounts.
Trend: A trend is the broad direction of a market or the price of an asset. In technical analysis, it is identified by trend lines (lines drawn over highs or lows to show the prevailing direction of price) or price action that make it clear when the price is headed higher (an uptrend) versus lower (a downtrend).
Upside Reversal: A change in the direction of the price of an asset from falling to rising.
Vertical Spread: A vertical spread involves the simultaneous buying and selling of options of the same kind (either calls or puts) and expiration date, but different strike prices. It is called a vertical spread because of the relation between the strike prices.
$VIX: The Chicago Board of Options Exchange (CBOE, Cboe) Volatility Index or $VIX (VIX) is a real-time market index, tied to the S&P 500, that gives the market’s expectation of volatility over the next 30 days. Traders and investors use the $VIX to measure the market’s sense of risk and fear when entering a trade or making an investment. Often there is an inverse correlation between the $VIX and the direction of the S&P 500, such that the $VIX rises when the S&P 500 falls and vice-versa. There are also volatility indices for other market indices, for instance the NASDAQ ($VXN), the Dow ($VXD), the Russell 2000 ($RVX), and many others.
Volatility: The volatility of an asset is a measure of how large the actual price swings around the mean price of that asset are, that is, it is a statistical measure of the dispersion of the potential returns on that asset. Volatile assets are generally regarded as riskier than less volatile assets because the price is less predictable.
Volatility Crush: When the implied volatility of an option is high because of an impending event with an uncertain outcome—say earnings, or an announcement of progress toward the development of a product by a company, or some such thing—then it will decline after the event is over. Once the uncertainty of the impending event is removed, there can be a rapid deflation in implied volatility that is sometimes called a volatility crush.
Volatility Index: A volatility index gives a market index’s expectation of volatility over a period of time, usually 30 days. There are volatility indices for a variety of market indices. See $VIX.
Volume: The volume of a tradable asset is the number of shares traded during a specified period of time. Assets with higher daily volume are more liquid than those with lower volume and thus more easily tradable. Trading volume is an important technical analysis indicator because it measures the relative significance of a move in the market. When a directional price move happens with high volume, it is more significant and more likely indicative of a trend, whereas a low volume move is less significant.
Volume Weighted Average Price (VWAP): The volume weighted average price (VWAP) is calculated as the sum of the price paid for every transaction (the sum of the price multiplied by the number of shares) divided by the sum of the shares (total number of shares) traded, that is, it’s the sum of the price times the volume divided by the total volume. The VWAP can serve as an important indicator for traders. For example, when a stock’s price crosses over the VWAP to the upside, a trader may enter long because this event signals that buyers are stepping in and upward momentum is being established. The previous time-frame’s VWAP can then be taken as a support level for the trade such that, if the price drops below this support again, the trader will exit. Similarly, when the price crosses below the VWAP, it is a bearish signal that there is an increase in sellers, downward momentum is being established, and it is a good time to go short. In this case, the VWAP will serve as resistance and crossing it to the upside will be a buy-to-close signal.
Wave Indicator: The wave indicator is a directional trend indicator developed by the trader Rodney Julian. It measures the short-term (A wave), medium-term (B wave), and long-term (C wave) trends on whatever market and whatever time frame the trader decides to watch. Roughly, an A wave measures the trend for the last six period bars, the B wave for the last fifteen, and the C wave for the last thirty. The C wave functions as an anchor for the longer term market direction, while the A wave serves as an entry indicator for intraday trades if it crosses over in the same direction. For an introduction to wave analysis, see here: https://intercom.help/simpler-trading/en/articles/3499653-about-abc-waves. The TTM Wave indicator can be paired helpfully with the average directional index (ADX) and TTM Squeeze indicators. All of these are available on the thinkorswim trading platform that comes with a TD Ameritrade account and also on the TradeStation platform.
References and Recommended Reading
Achelis, Steven B. (2013) Technical Analysis from A to Z, 2nd Edition. New York: McGraw-Hill Education.
Carter, John F. (2019) Mastering the Trade: Proven Techniques for Profiting from Intraday and Swing Trading Setups, 3rd Edition. New York: McGraw-Hill Education.
Chen, James. (2019) “E-mini.” Available at: https://www.investopedia.com/terms/e/emini.asp.
Chen, James. (2020) “Index Futures.” Available at: https://www.investopedia.com/terms/i/indexfutures.asp.
Cohen, Guy. (2013) Options Made Easy: Your Guide to Profitable Trading. New York: Financial Times Prentice Hall.
Douglas, Mark. (2000) Trading in the Zone: Master the Market with Confidence, Discipline, and a Winning Attitude. New York: New York Institute of Finance.
Federal Reserve Bank of St. Louis. “S&P 500.” Available at: https://fred.stlouisfed.org/series/SP500.
Malkiel, Burton G. (2020) A Random Walk Down Wall Street: The Time-Tested Strategy for Successful Investing, 12th Edition. New York: W.W. Norton & Company, Inc.
Mitchell, Cory. (2019) “S&P 500 Mini.” Available at: https://www.investopedia.com/terms/s/sp_500_mini.asp.
Overby, Brian. (2018) The Options Playbook. Detroit: Ally Financial Inc.
Ross, Sean. (2020) “How Do S&P 500 Futures Work?” Available at: https://www.investopedia.com/ask/answers/042315/how-do-sp-500-futures-work.asp.
Telser, Lester G. (1986) “Futures and Actual Markets: How They Are Related,” Journal of Business, vol. 59, no. 2, pp. S5-S20.
U.S. Securities and Exchange Commission, “Market Indices.” Available at: https://www.sec.gov/fast-answers/answersindiceshtm.html.
Voit, Johannes. (2005) The Statistical Mechanics of Financial Markets, 3rd Edition. Berlin: Springer-Verlag.