You can’t examine the health care industry without including the pharmaceutical industry in your exploration. Much of the research and development that goes on in the health care field pertains to producing new treatments in the form of pharmaceutical drugs. Pharmaceuticals account for a large—and growing—percentage of total health expenditures in the United States.
Not every patient spends anywhere near the same amount of money purchasing prescription drugs. A variety of factors affect pharmaceutical drug spending for individual patients in our country.
The demand for any given pharmaceutical product depends on patients’ health needs and health care access. Unlike personal care products that virtually everyone needs (like soap and shampoo), a patient will only make the attempt to purchase a prescription medication if they have a need or indication for the medicine and access to a doctor who will prescribe it. Then there are matters of supply.
Factors like the cost, insurance coverage, and availability of the individual drug determine whether the patient will actually get the drug that has been prescribed to them. Even with health insurance, the out-of-pocket cost of prescription drugs can be unaffordable. For patients without health insurance, who bear the full financial burden of paying for prescription medication, the drugs they need may be unattainable.
A close look at the pharmaceutical industry sales data reveals that spending patterns differ sharply among different demographics. Certain populations use (and purchase) considerably more pharmaceuticals, and particularly prescription medications, than others.
Key Insights
Which Demographics Matter the Most in Pharmaceutical Drug Usage?
Some of the biggest demographic factors in pharmaceutical medicine usage include age, gender, race and ethnicity. On average, older patients use more pharmaceuticals than younger patients. A higher percentage of females take prescription medications than males. Non-Hispanic white patients are more likely to take prescription medications than other races and ethnicities.
How Do Medical Conditions Affect the Extent of Pharmaceutical Drug Usage?
Another major factor that determines pharmaceutical drug spending is the medical condition or conditions that patients need to manage. Chronic conditions, in particular, can pose a high cost due to the need for long-term, continuous treatment. Although medical conditions themselves may not constitute individual demographics, for many such conditions, there are demographic-related risk factors to consider.
What Factors Are Behind the Demographic Data Pertaining to Pharmaceutical Drug Sales?
In many ways, demographic distinctions in the use of pharmaceutical products represent the intersection of disparities across the health care system, health status and risk factors for common medical conditions, cost and the ability to pay for medical interventions, and gender roles and consumerism.
The Pharmaceutical Drug Industry
Before we can understand more about the demographics of the end user of pharmaceutical products, we need to identify what products are considered part of the pharmaceuticals industry in the first place.
Types of Pharmaceutical Industry Products
The pharmaceutical industry encompasses all kinds of medicines and drugs intended for medicinal use. These drugs are proven through research to treat, cure, or prevent illness, disease, or disorder. Pharmaceuticals may be prescribed as treatments for acute conditions and symptoms, such as antibiotics for a bacterial infection, or for the management of chronic or long-term conditions, such as insulin for diabetes.
Pharmaceutical companies tend to invest the most money into the research and development of drugs for a large audience—that is, to prevent, manage, treat, or cure more common health conditions. Research and development work may also be done to produce new drugs for rare conditions, also called orphan drugs.
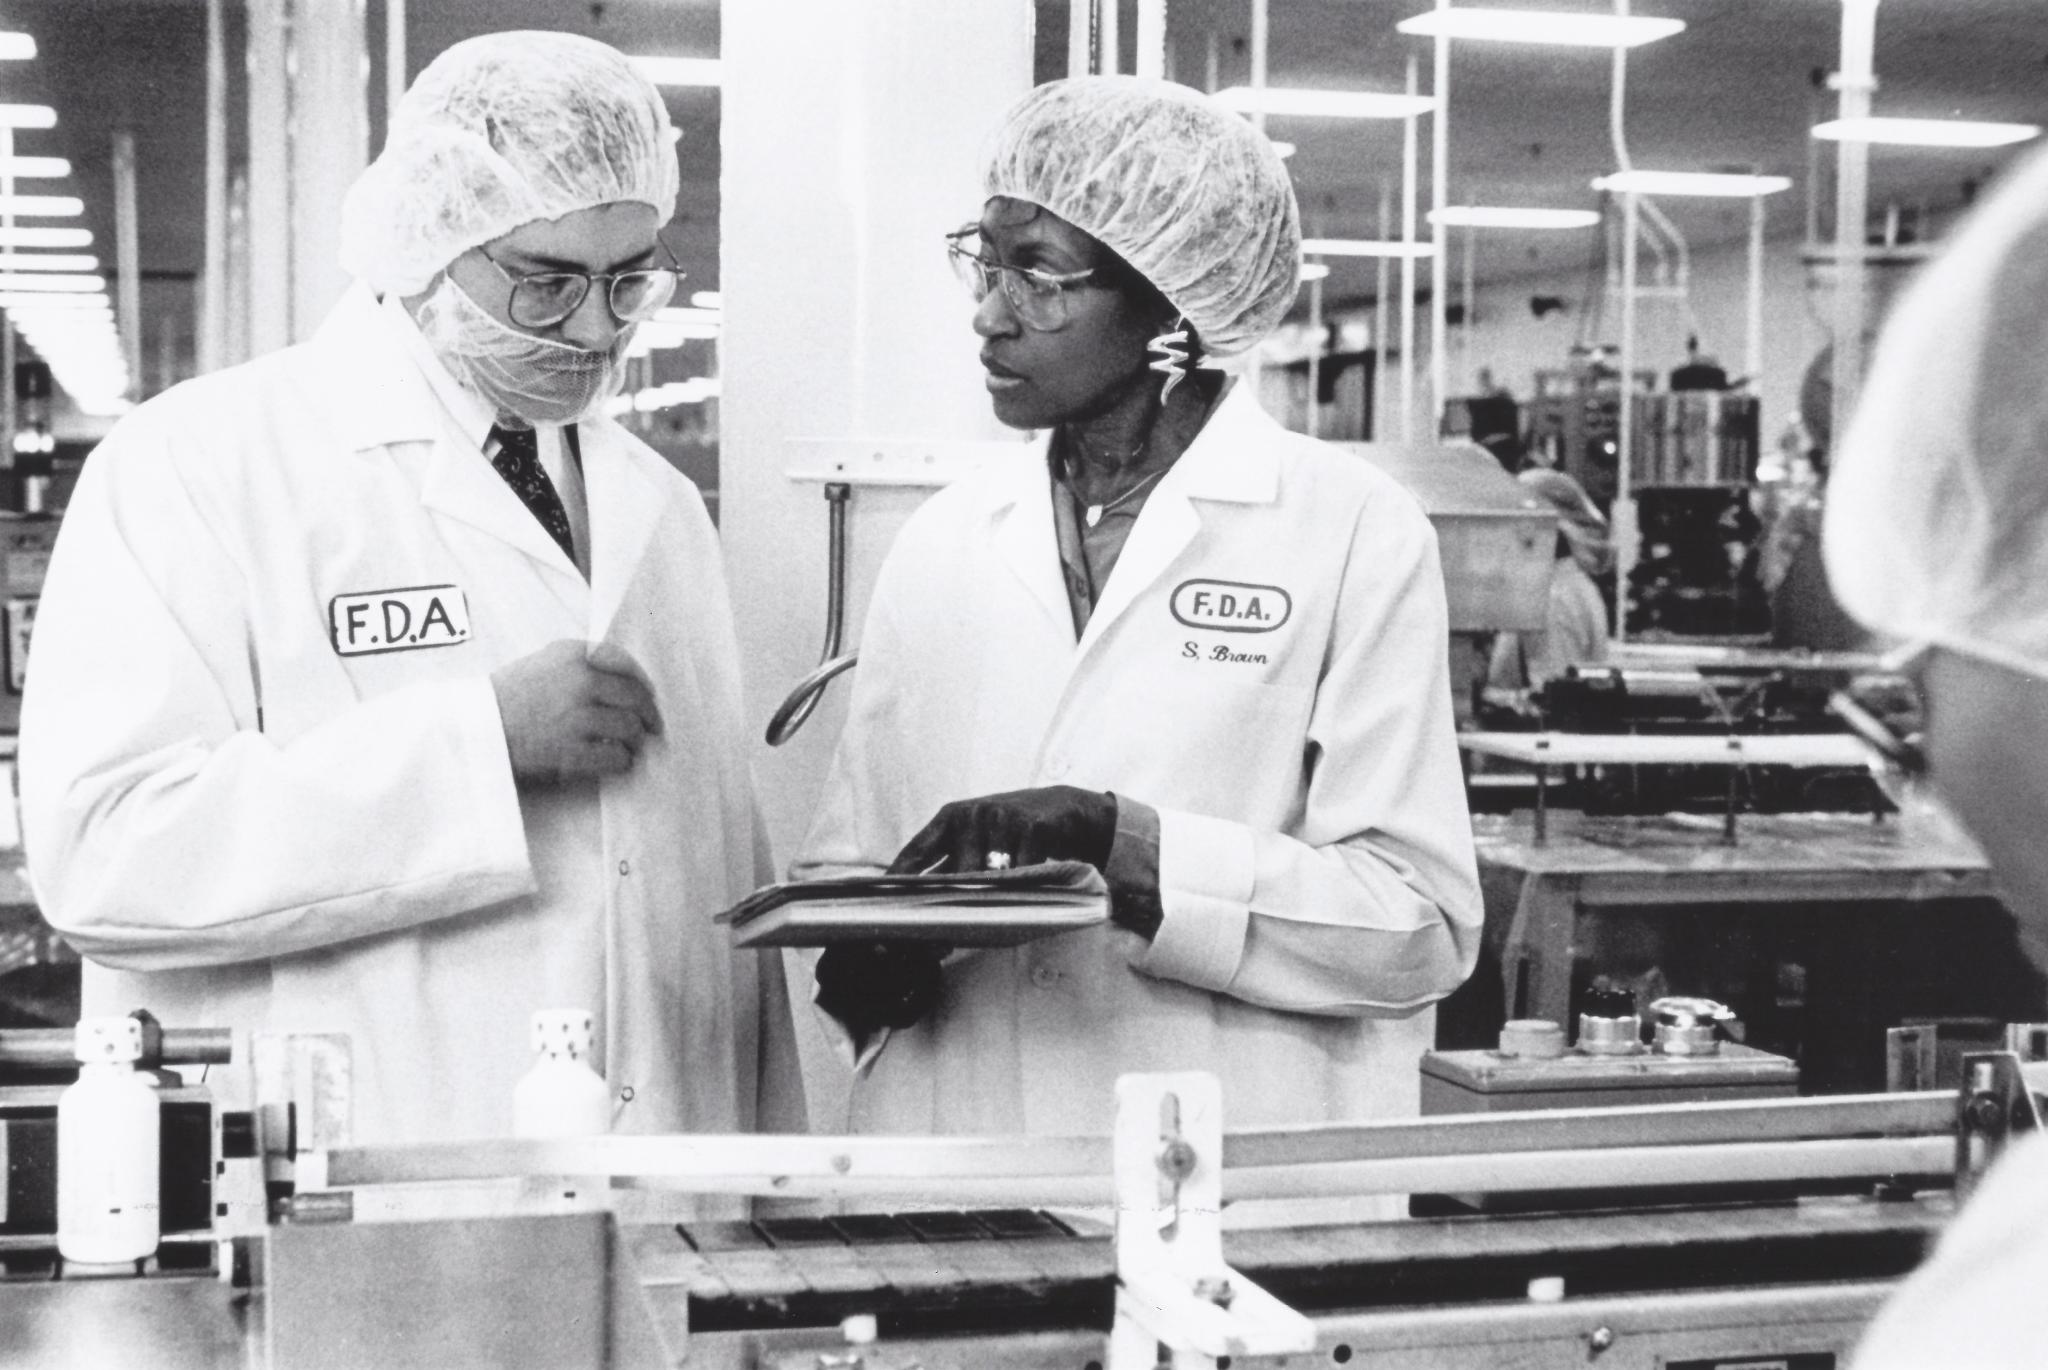
Pharmaceuticals do not include nutritional supplements, sports supplements, and vitamin supplements, which support health and wellness in more general ways and which are subject to different FDA regulation and research requirements. It’s worth noting, though, that leading pharmaceutical companies are increasingly seeking to acquire or merge with successful companies in the supplement industry, according to Medium.
Brand Name vs. Generic Drugs
There are patented pharmaceutical medications sold under trademarked brand names—the ones in which television commercials, print advertisements, and other marketing materials often urge patients to “ask their doctor” about using the medicine—as well as generic drugs for which the patent has expired. Generally, generic drugs are lower-cost medications that the FDA considers equivalents of name brand drugs. According to the U.S. Department of Health & Human Services, generic drugs “must contain the identical amounts of the same active drug ingredient as the brand name product” and “be expected to have equal effect” compared to the name brand drug.
The Over-the-Counter Pharmaceutical Industry
When we think of the pharmaceutical industry, many of us automatically think of prescription pharmaceuticals, drugs that are specifically ordered by a physician or another health care professional and filled behind the counter of a pharmacy. However, the pharmaceutical industry also encompasses over-the-counter (OTC) medicine that patients can buy without a doctor’s prescription to treat or manage common conditions or symptoms. Over-the-counter medications range from painkillers like ibuprofen and acetaminophen to cough and cold medicine, heartburn medicine, and allergy medicine.
While many drugs have long been available over the counter (or behind the pharmacy counter with a valid physician’s prescription), recent years have seen a shift toward more medications, such as allergy medicine that was once available by prescription only, being made available on an OTC basis.
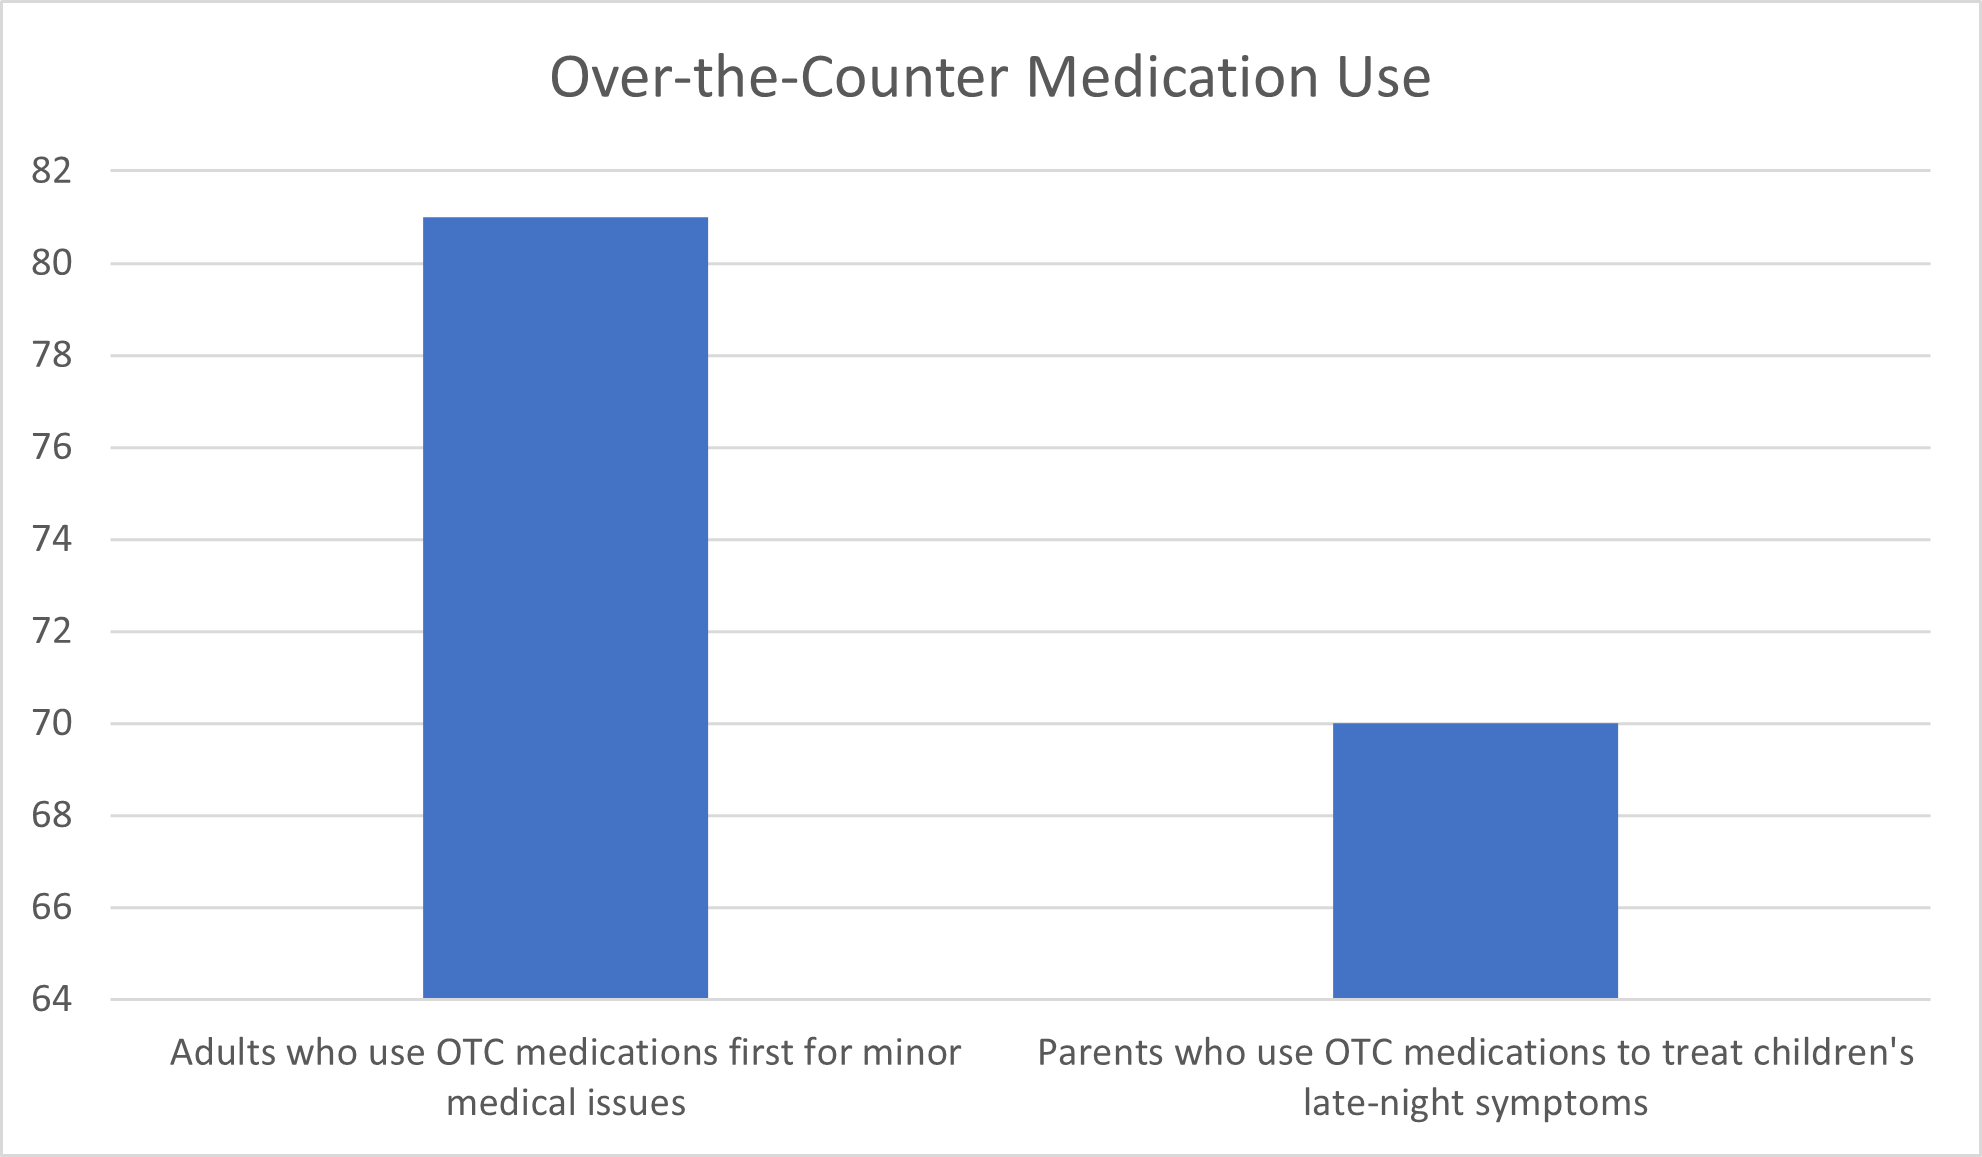
The over-the-counter pharmaceutical drug industry is booming. OTC medications, which the Consumer Healthcare Products Association calls “more convenient and affordable” than prescription medications, allow an estimated 60 million people to treat medical symptoms and are particularly critical to populations that have historically been underserved by the health care system. In fact, the Consumer Healthcare Products Association reported that 81% of adults turn to over-the-counter medications as first-line treatments for minor health issues, and almost 70% of parents report treating their children’s late-night sudden symptoms with OTC products.
Author’s Note
We will be focusing primarily on the demographics of the U.S. pharmaceutical industry in this article, but that isn’t only because Expensivity is U.S.-based. Rather, it’s because U.S. sales make up the single largest share of the total global pharmaceutical market sales.
The United States accounts for between 45% and 50% of the total global pharmaceutical market sales each year, according to Statista. What populations of Americans are buying pharmaceutical medicines? What drugs are they buying and why?
To find the answers to these questions, we will draw from data published in historical articles and recent studies.
Who Are the Target Audience for Pharmaceutical Companies?
Who is the primary customer of pharmaceutical companies?
Americans spent a total of $574 billion on medicines in 2021, Statista reported. Per-capita spending on pharmaceuticals in the United States is much higher than in other high-income countries and has exceeded $1,000 per person since 2015, according to The Commonwealth Fund. In recent years, the percentage of total spending on personal health care services among American patients has climbed to almost 12%, compared to 7% during the 1990s, the U.S. Government Accountability Office reported.
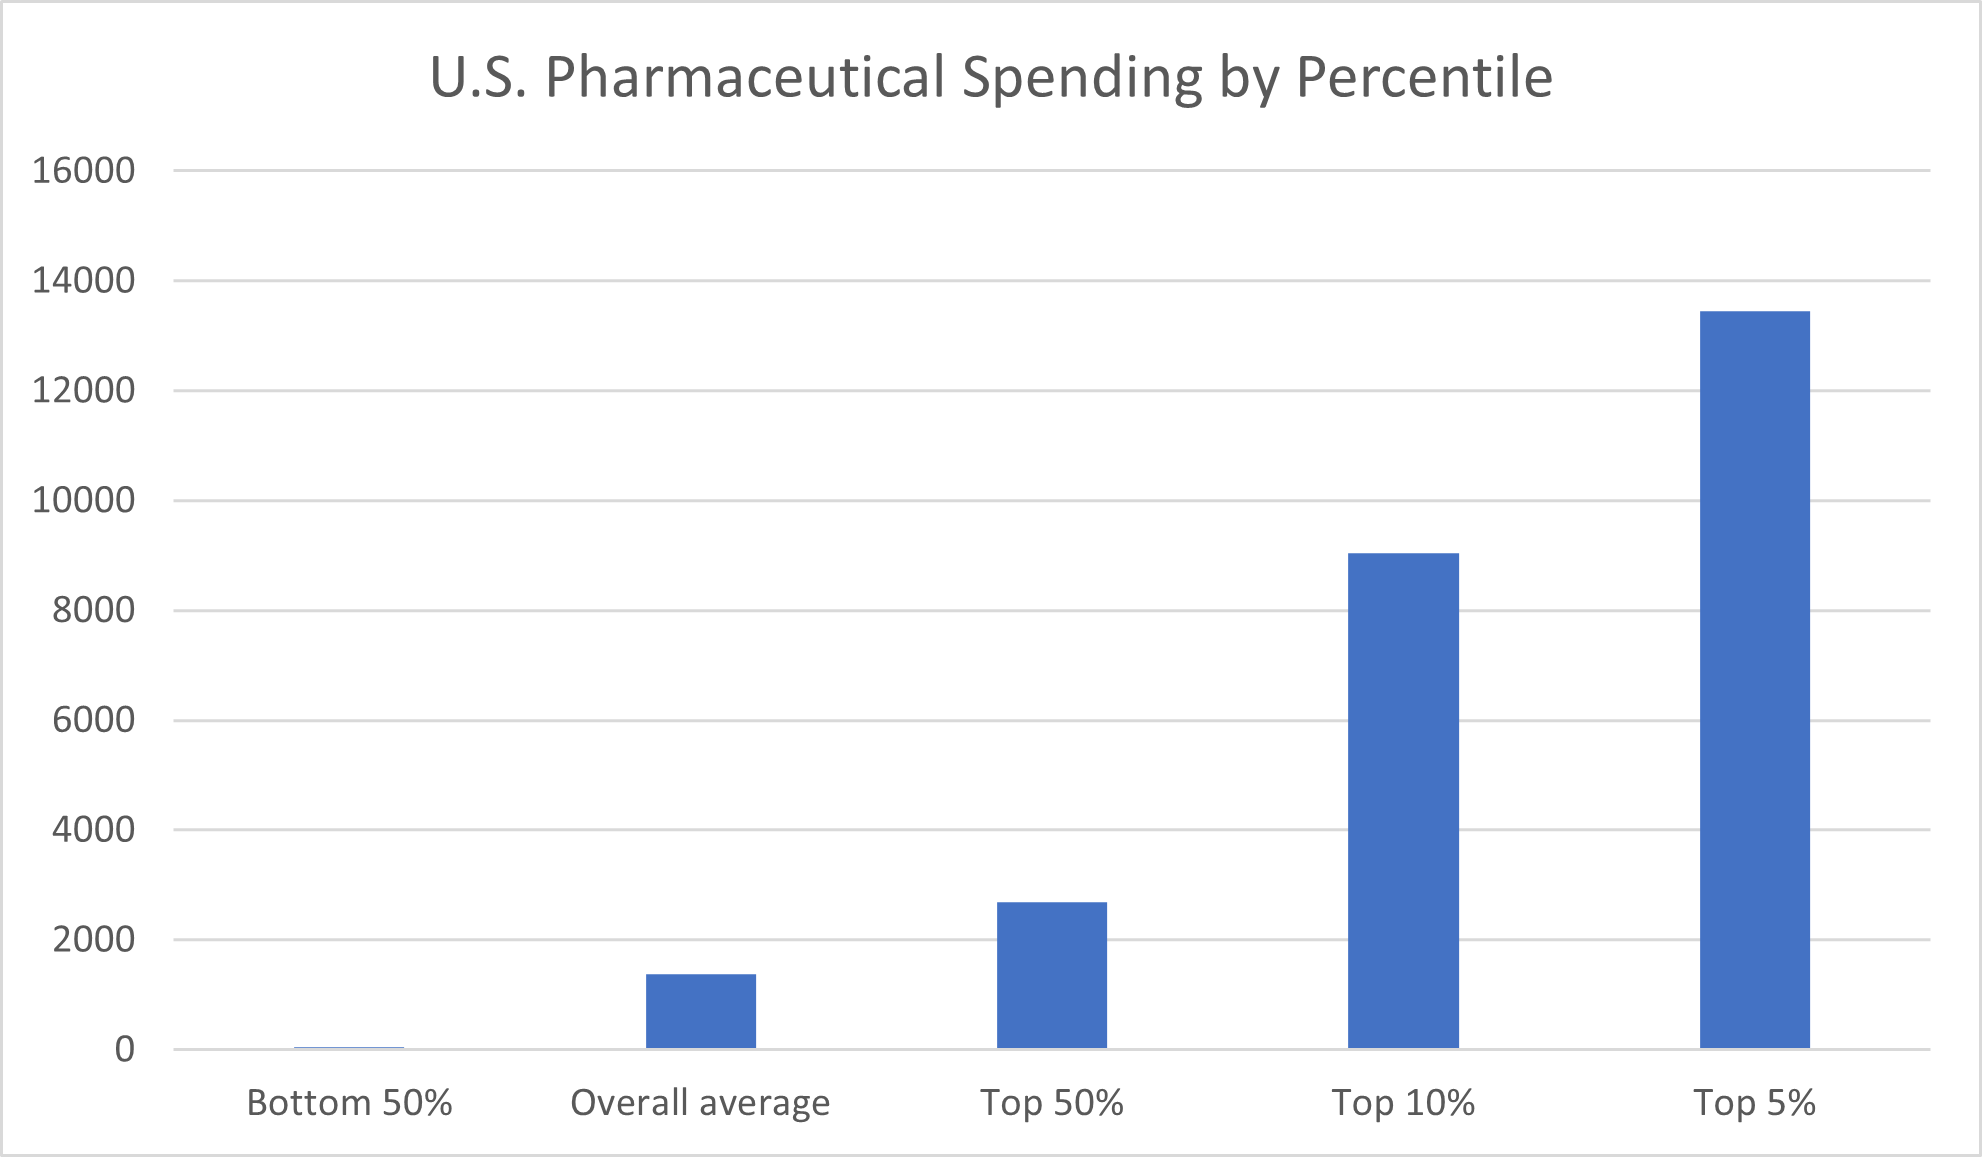
Certainly, pharmaceutical spending isn’t the same across all populations. While the average health spending amount on prescribed medications in 2019 for the overall population amounted to $1,371, the comparably small percentage of high-spending outliers in the top percentiles skews this figure considerably.
While those in the top 50% of prescribed medication spending reported expenditures of $2,696, those in the bottom 50% spent an average of just $48, according to the Peterson-KFF Health System Tracker. If that distinction seems extreme, that’s because it is. The exceptionally high prescribed drug expenditures among the top 5% and top 10%—$13,455 and $9,037, respectively—drag the average pharmaceutical spending rate upward.
As you might expect, some demographics are associated with much higher rates of purchasing pharmaceutical products than others.
Pharmaceutical Industry Spending by Age
The number-one demographic factor that affects spending on pharmaceutical products is age. Advanced age tends to correspond to poorer health and greater risk for a variety of medical conditions. In turn, older adults are, on average, more likely to use pharmaceutical products and to be taking a greater number of prescribed and over-the-counter pharmaceutical products per year compared to patients in younger age groups.
Both today and historically, the elderly have been vastly overrepresented in pharmaceutical expenditures compared to their proportion of the American population. A 1997 article published in the American Journal of Public Health reported that elderly patients made up 34% of all pharmaceutical expenditures despite accounting for only 12% of the population.
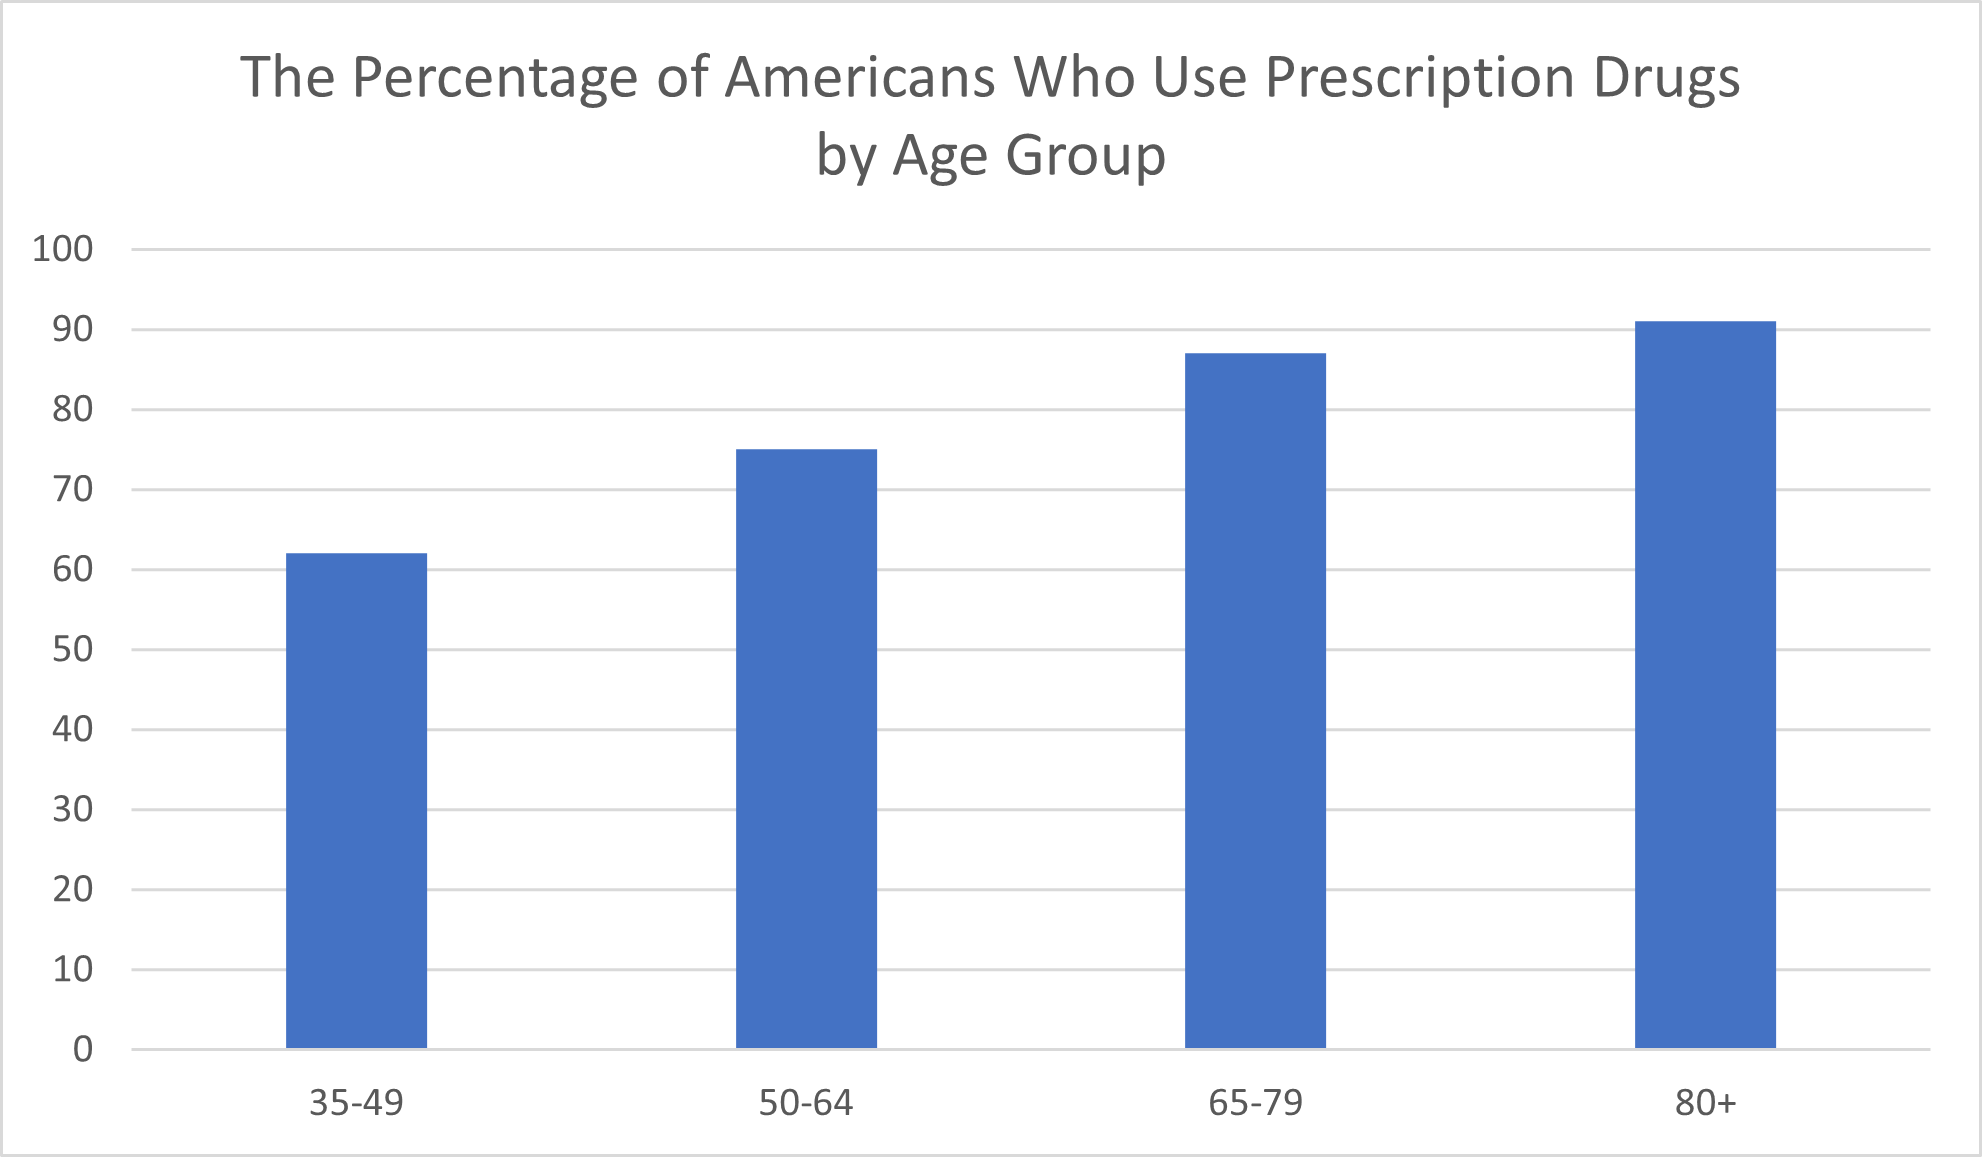
According to the Health Policy Institute at Georgetown University, 53% of Americans in the 18 to 34 age group reported using prescription drugs, filling an average of three prescriptions per year. The proportion of adults in the 35 to 49 age group who used prescribed medications increased by nearly 20% compared to the previous age group, with 62% of this population using prescribed drugs, and the number of prescriptions filled per year doubled to six.
For the 50- to 64-year-old age group, 75% of individuals take prescription drugs, and the average number of scripts filled annually more than doubled compared to the previous age group, at 13. Among 65- to 79-year-olds, 87% take at least one prescription medicine, and the average number of prescriptions this age group fills annually amounts to 20. Incidence of prescription drug use among the 80-year-old and above crowd climbed to 91%. On average, this age group of octogenarians, nonagenarians, and centenarians reported filling 22 prescriptions per year.
One particularly concerning piece of data is how much more seniors pay out of pocket for their medicine compared to other age groups. While adults in general pay 48% of their prescription medication costs out of pocket, those in the 65- to 79-year-old bracket pay 56% of the costs out of pocket, the Health Policy Institute at Georgetown University reported. Among the 80-year-old and above population, out-of-pocket costs climbed to 67% of total pharmaceutical drug expenditures. That’s a huge burden, particularly for seniors who are, by this age, typically retired and living on a fixed income.
Pharmaceutical Spending by Health Condition
The more chronic, or long-term, health conditions a person needs to manage, the greater their pharmaceutical health expenditures, on average. The American Journal of Public Health article referenced above also reported that the 36% of elderly patients studied who had three or more chronic health conditions accounted for 57% of this age group’s considerable drug expenditures. Among non-elderly adults, the one-third of the population that reported having one or more chronic health conditions made up two-thirds of this age group’s pharmaceutical spending.
In particular, the Americans who spend the most money on prescription drugs are older and have health conditions like the following, according to Peterson-KFF Health System Tracker:
- Respiratory conditions
- Infectious diseases
- Parasitic diseases
- Cancers
- Digestive diseases
- Circulatory diseases
- Endocrine disorders
- Mental illness
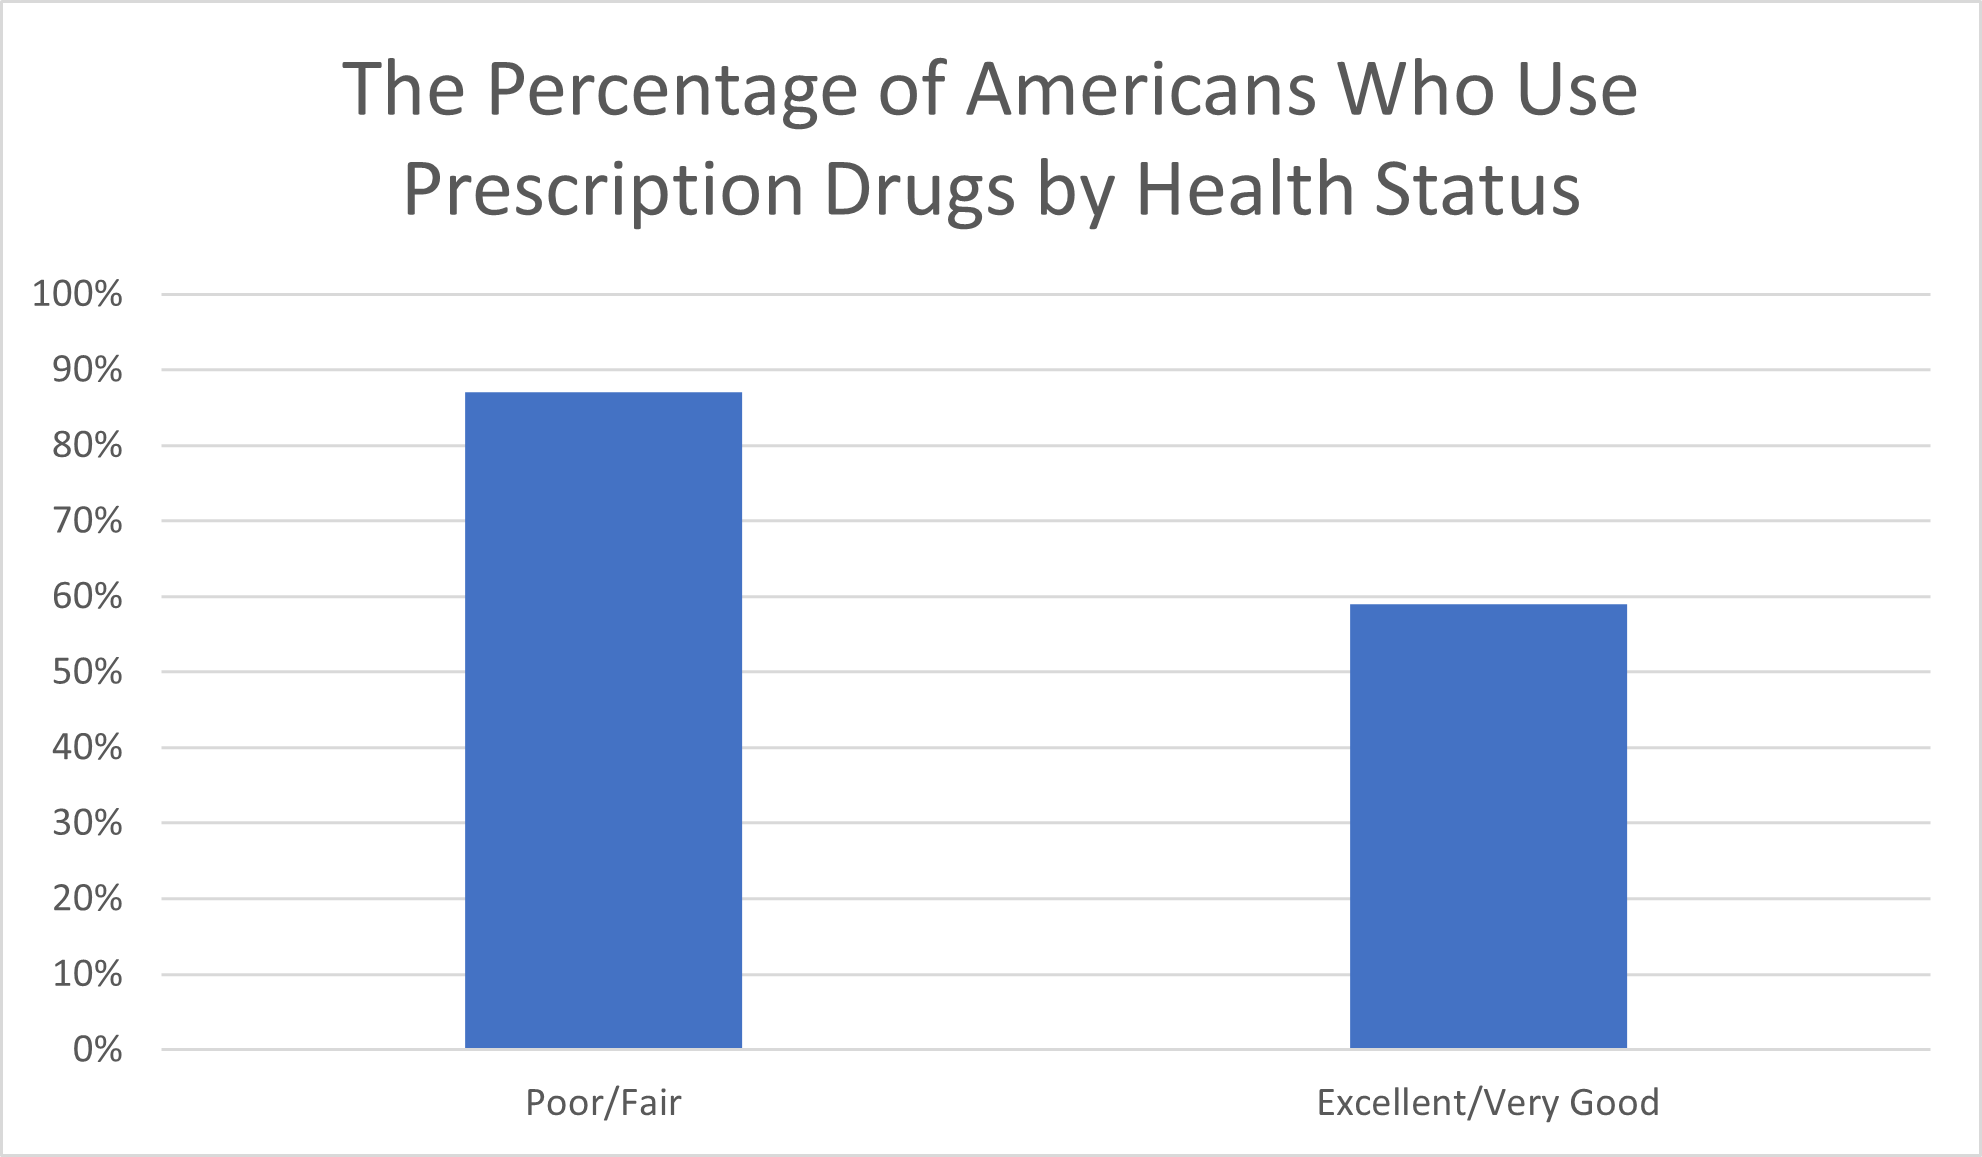
It probably doesn’t surprise you that the vast majority (87%) of individuals whose health status is regarded as “fair/poor” take prescription medicines, or that this group is associated with the highest average number of prescriptions (24) per year. What might surprise you, though, is that 59% of individuals whose health status is described as “excellent/very good” also take prescription medicines, averaging five filled prescriptions per year, the Health Policy Institute at Georgetown University reported.
These statistics, in particular, speak to what a 2020 article published in the British Journal of Clinical Pharmacology called “two contradicting trends.” Compared to previous generations, the authors noted, people in more recent generations are, on average, experiencing increased longevity and improved overall health and quality of life—yet they are also developing more health problems (multimorbidity) at younger ages. New drugs and other breakthroughs in clinical development and treatments are successfully managing medical conditions to help patients live longer, healthier, and higher-quality lives even with one or more long-term health conditions.
Pharmaceutical Spending by Gender
There are notable divides in pharmaceutical industry spending across genders. While the proportion of the total population of males in the U.S. that reports prescription medication use amounts to more than half (56%), the proportion of females who use prescribed medications amounts to three-quarters, the Health Policy Institute at Georgetown University reported. Additionally, while males have an average of seven prescriptions filled each year, females have an average of 11 prescriptions filled.
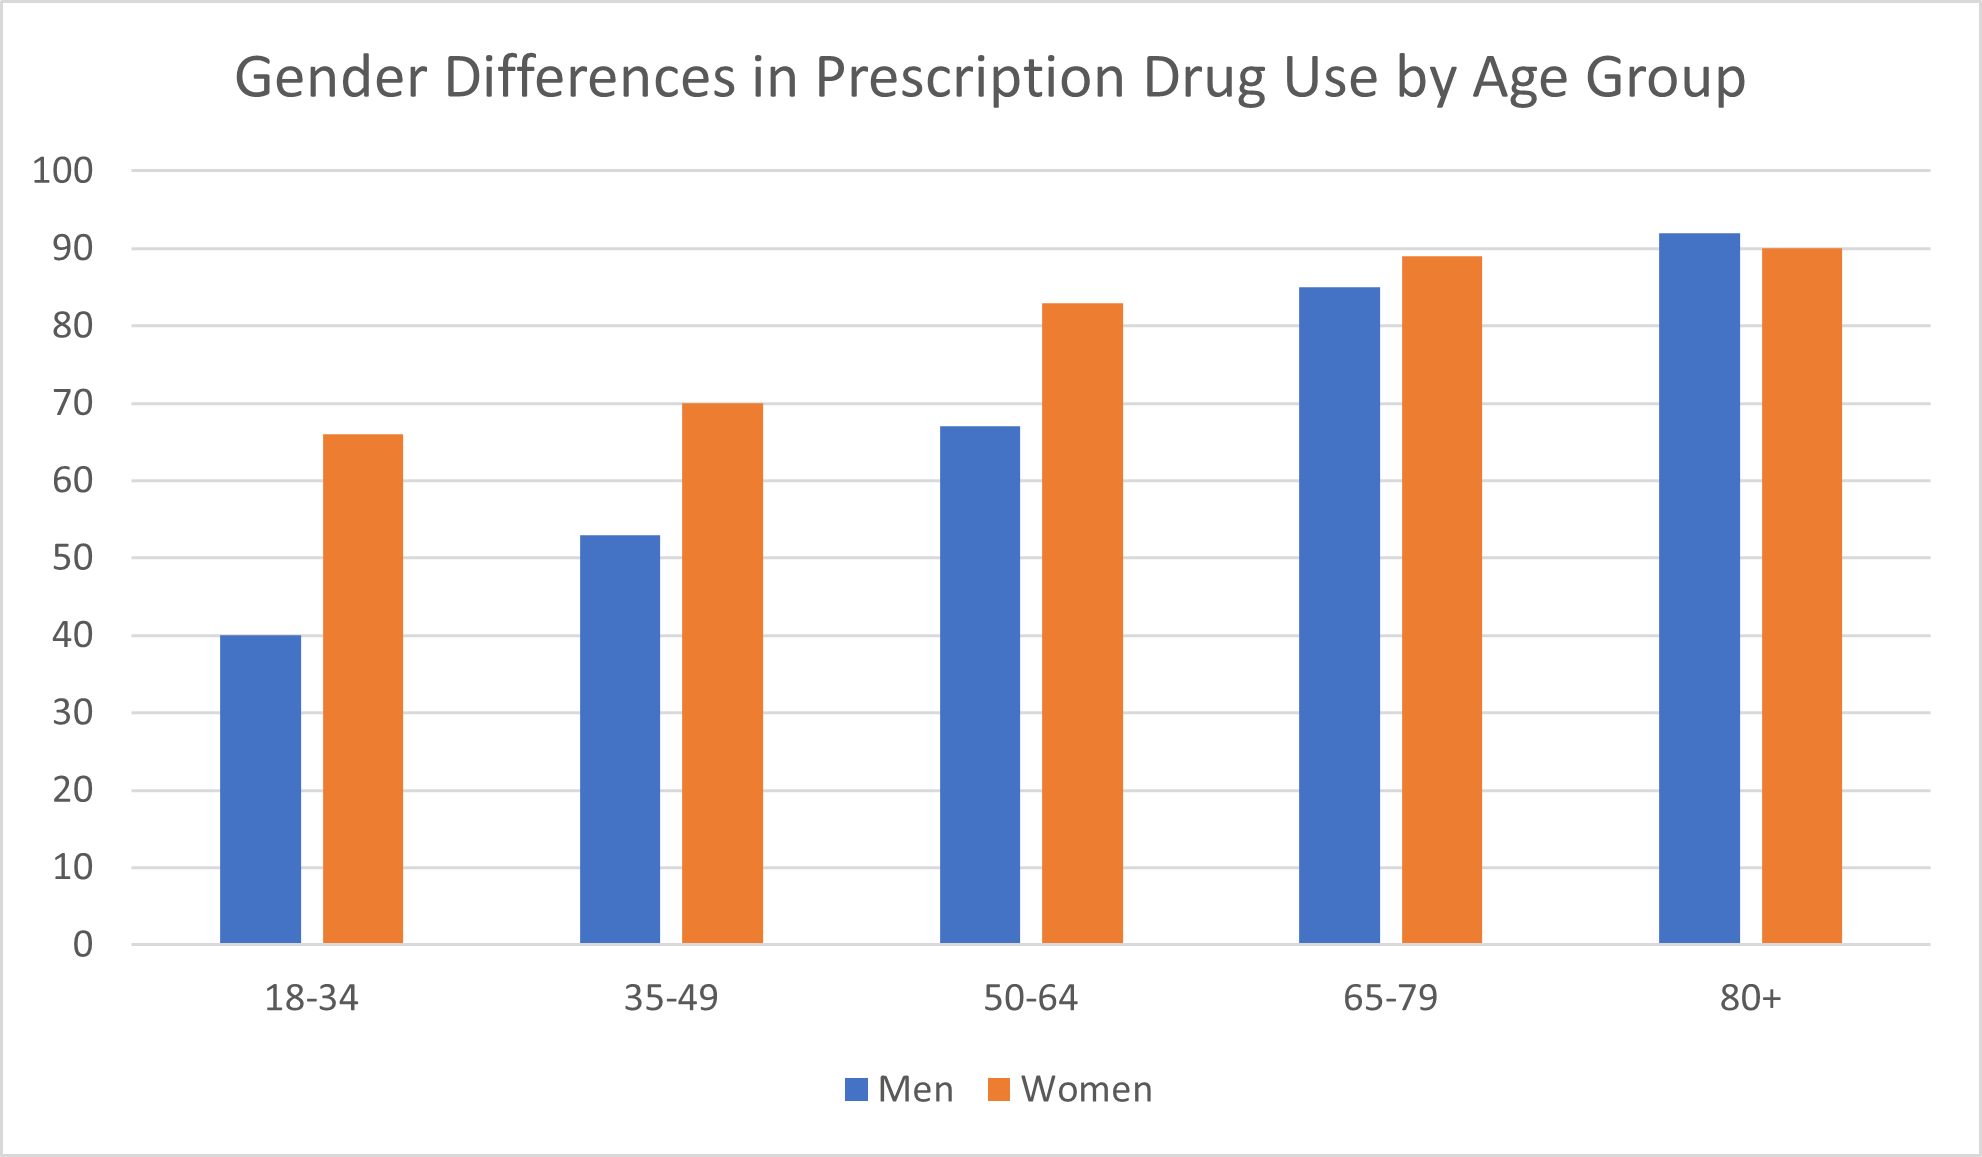
Interestingly, this gender divide in pharmaceutical drug spending exists across age groups but narrows with age. The Health Policy Institute at Georgetown University reported that 66% of females in the 18- to 34-year-old age group used prescription medicines, compared to just 40% of males. In other words, females in this young age group were 65% more likely than males of the same age to be taking prescriptions.
By the 35- to 49-year-old age group, the number of males taking prescription medications climbs more sharply than females—to 53% compared to 70%—yet females are still upwards of 30% more likely to be taking prescriptions than men in the same age group.
While 67% of men in the 50- to 64-year-old age group were taking prescription medicines, 83% of women in the same age group were. By the time they reach the 65- to 79-year-old age group, 85% of men and 89% of women take prescription medicines. Only in the 80-and-above age group do males take prescription medications at a (slightly) higher rate than females, 92% to 90%.
Unsurprisingly, women are also more likely to purchase over-the-counter pharmaceutical industry products—as they are other consumer products. Forbes reported in 2019 that women are responsible for making between 70% and 80% of all consumer purchasing decisions.
Pharmaceutical Medication Use by Race and Ethnicity
White non-Hispanic individuals are more likely than those of other races and ethnicities to take prescription medications, according to the Health Policy Institute at Georgetown University. For example, 67% of non-Hispanic respondents reported taking prescription medicines compared to just 53% of Hispanic respondents, and prescription drug usage was considerably higher among whites than Blacks.
Historically, racial disparities in prescription medication usage have existed as early as childhood. “Black children had 22–30 percent lower odds of receiving a prescription medication than white children after adjusting for potentially confounding factors,” researchers concluded in an article published in the journal Health Services Research in 2006.
The distinctions in prescription drug use by race and ethnicity shouldn’t be interpreted as an indication of better health but rather as disparities in the quality of health care received. According to the CDC, “The data show that racial and ethnic minority groups, throughout the United States, experience higher rates of illness and death across a wide range of health conditions, including diabetes, hypertension, obesity, asthma, and heart disease, when compared to their White counterparts.”
Since the gap in pharmaceutical medicine usage among minority racial and ethnic populations compared to non-Hispanic white patients can’t be explained by health status alone, it’s reasonable to suppose that some of the known disparities in the health care system likely play a part in this outcome.
Disparities exist throughout the health care system that influence how different demographic populations contribute to pharmaceutical industry spending. For example, higher uninsured rates among racial and ethnic minorities prevent people from going to the doctor in the first place.
Insurance policies that provide less extensive coverage may leave the patient with less access to the medication they need or with a higher personal financial obligation, which in turn discourages the patient from sticking with the prescribed treatment.
Disparities in how physicians approach and treat patients of different minority groups may lead them to fail to prescribe medications that they would generally prescribe to white male patients with the same health issues and risk factors.
Drug Development Demographics
We’ve examined the data on who is buying the medicines that support the pharmaceutical industry, but what about who is developing these therapies?
According to Zippia, 63% of drug development professionals with the job title “pharmaceutical scientist” are male and 37% are female.
The largest share of the pharmaceutical scientist occupation in the United States, 56.3%, is white. More than one-quarter (26.8%) of pharmaceutical scientists are Asian. Hispanic or Latino workers make up 8.6% of the pharmaceutical scientist occupation, while Black or African American workers account for 5.5% of workers with this job title. Another 2.5% of pharma,ceutical scientists are listed as “unknown” race, and 0.3% are listed as “American Indian” and Alaska Native.
The average age of pharmaceutical scientists in 2019 was 41.1 years. Nearly half of all working pharmaceutical scientists were over age 40, while 37% were in the 3o to 40 age group and another 14% were in the 20 to 30 age group.
Based on this data, the “average” pharmaceutical scientist is a white male in his 40s. However, other populations—women, other races, and other age groups—are seeing more representation in this career than they once did. Although there’s still quite a way to go before minority groups are represented in the pharmaceutical scientist occupation in quantities that reflect their percentage of the total population, this development is positive. After all, having people from a diverse array of perspectives and backgrounds is valuable for solving problems in new ways.
As you might expect, pharmaceutical scientists are a highly educated bunch. Virtually all pharmaceutical scientists go to college, and the vast majority of them hold a minimum of a bachelor’s degree. A bachelor’s degree is the most common level of education reported for this occupation, accounting for 63% of the workforce. Another 23% of pharmaceutical scientists report having a master’s degree, and 11% have a doctorate.
Who Are the Biggest Players in the Pharmaceutical Industry?
Who dominates the pharmaceutical industry? Many, although not all, of these companies are household names: Johnson & Johnson, Pfizer, Merck, AstraZeneca, Bristol-Myers Squibb, and more.
Based on their market share of the worldwide prescription drug market in 2019 and as forecasted for 2026, the leading pharmaceutical companies in the world, according to Statista, are the following:
- AbbVie, a pharmaceutical company that made up just 3.7% of the global drug market share in 2019 and for which the current growth rate should result in an industry-leading 4.2% of the market by 2026
- Roche, which led the industry with 5.5% of the market share in 2019 but is expected to decline to 4.1% of the global prescription pharmaceutical market by 2026
- Novartis, which in 2019 amounted to 5.3% of the worldwide drug market share but by 2026 is forecasted to make up a more modest 4.1% of the market
- Johnson & Johnson, another of the pharmaceutical companies whose worldwide drug market share is expected to decline, from 4.6% in 2019 to 3.8% in 2026
- Merck & Co., which accounted for 4.7% of the prescription drug market in 2019 but is expected to make up 3.8% of the market in 2026
- Sanofi, which made up 4% of the pharmaceutical prescription drug market in 2019 but is likely to decline to 3.8% by 2026
- Pfizer, which controlled 5% of the market share in 2019 but is expected to decline to 3.5% in 2026
- Bristol-Myers Squibb, for which the current growth rate is forecasted to increase market share from 2.9% in 2019 to 3.4% in 2026
- AstraZeneca, another of the pharmaceutical companies expected to see a positive market share growth rate, from 2.7% in 2019 to 3.1% in 2026
- GlaxoSmithKline, which in 2019 made up 3.6% of the market share but by 2026 is expected to decline to 2.9%
Keep in mind that just because certain pharmaceutical companies’ market shares a projected to decline doesn’t mean that the pharmaceutical industry as a whole is declining. In fact, the opposite is true. Business Wire reported in May 2022 that the global pharmaceutical manufacturing market is forecasted to grow by a compound annual growth rate (CAGR) of 12.38% by 2026, bringing the total size of the industry to $509.45 billion by 2026.
For pharmaceutical companies, there is a great deal of competition. Although strong competition can pose challenges for pharmaceutical companies and the stakeholders who benefit from their profits, it also advances the future of the field of health care as a whole by encouraging the research and development of new treatments.
Among the C-suite leadership of the leading pharmaceutical companies, you will find some racial, ethnic, and gender diversity. For example, Novartis CEO Vasant “Vas” Narasimhan is an Indian-American physician, and Richard A. Gonzalez, CEO of AbbVie, is a Hispanic man. GlaxoSmithKline’s CEO is a woman named Emma Walmsley.
If you look at smaller companies in the pharmaceutical space, you will find more minority-owned companies emerging. For example, African-American-led pharmaceutical and life science companies include Transdermal Specialties Global, Thrive Earlier Detection Corp., ARMR Systems, LucasPye Bio, TruGenomix, Quality Biological, and JuneBrain, Inc. Woman-founded pharmaceutical and health biotech companies include Verge Genomics, 1910 Genetics, and Talus Bio.
The Best-Selling Pharmaceutical Drugs in the World
Based on worldwide sales of pharmaceutical products during 2021, the number-one most profitable pharmaceutical product in the world would be Comirnaty, an mRNA COVID-19 Vaccine made by BioNTech/Pfizer. Statista reported that BioNTech/Pfizer raked in $36.9 billion in sales worldwide from Comirnaty in 2021.
The drug with the next highest sales volume, Humira, reported $20.7 billion in sales. Humira is a rheumatoid arthritis drug produced by AbbVie.
Spikevax, Moderna’s COVID-19 vaccine, followed with $17.7 billion in sales. Merck & Co.’s cancer immunotherapy drug Keytruda was close on its heels, with worldwide sales of $17.2 billion.
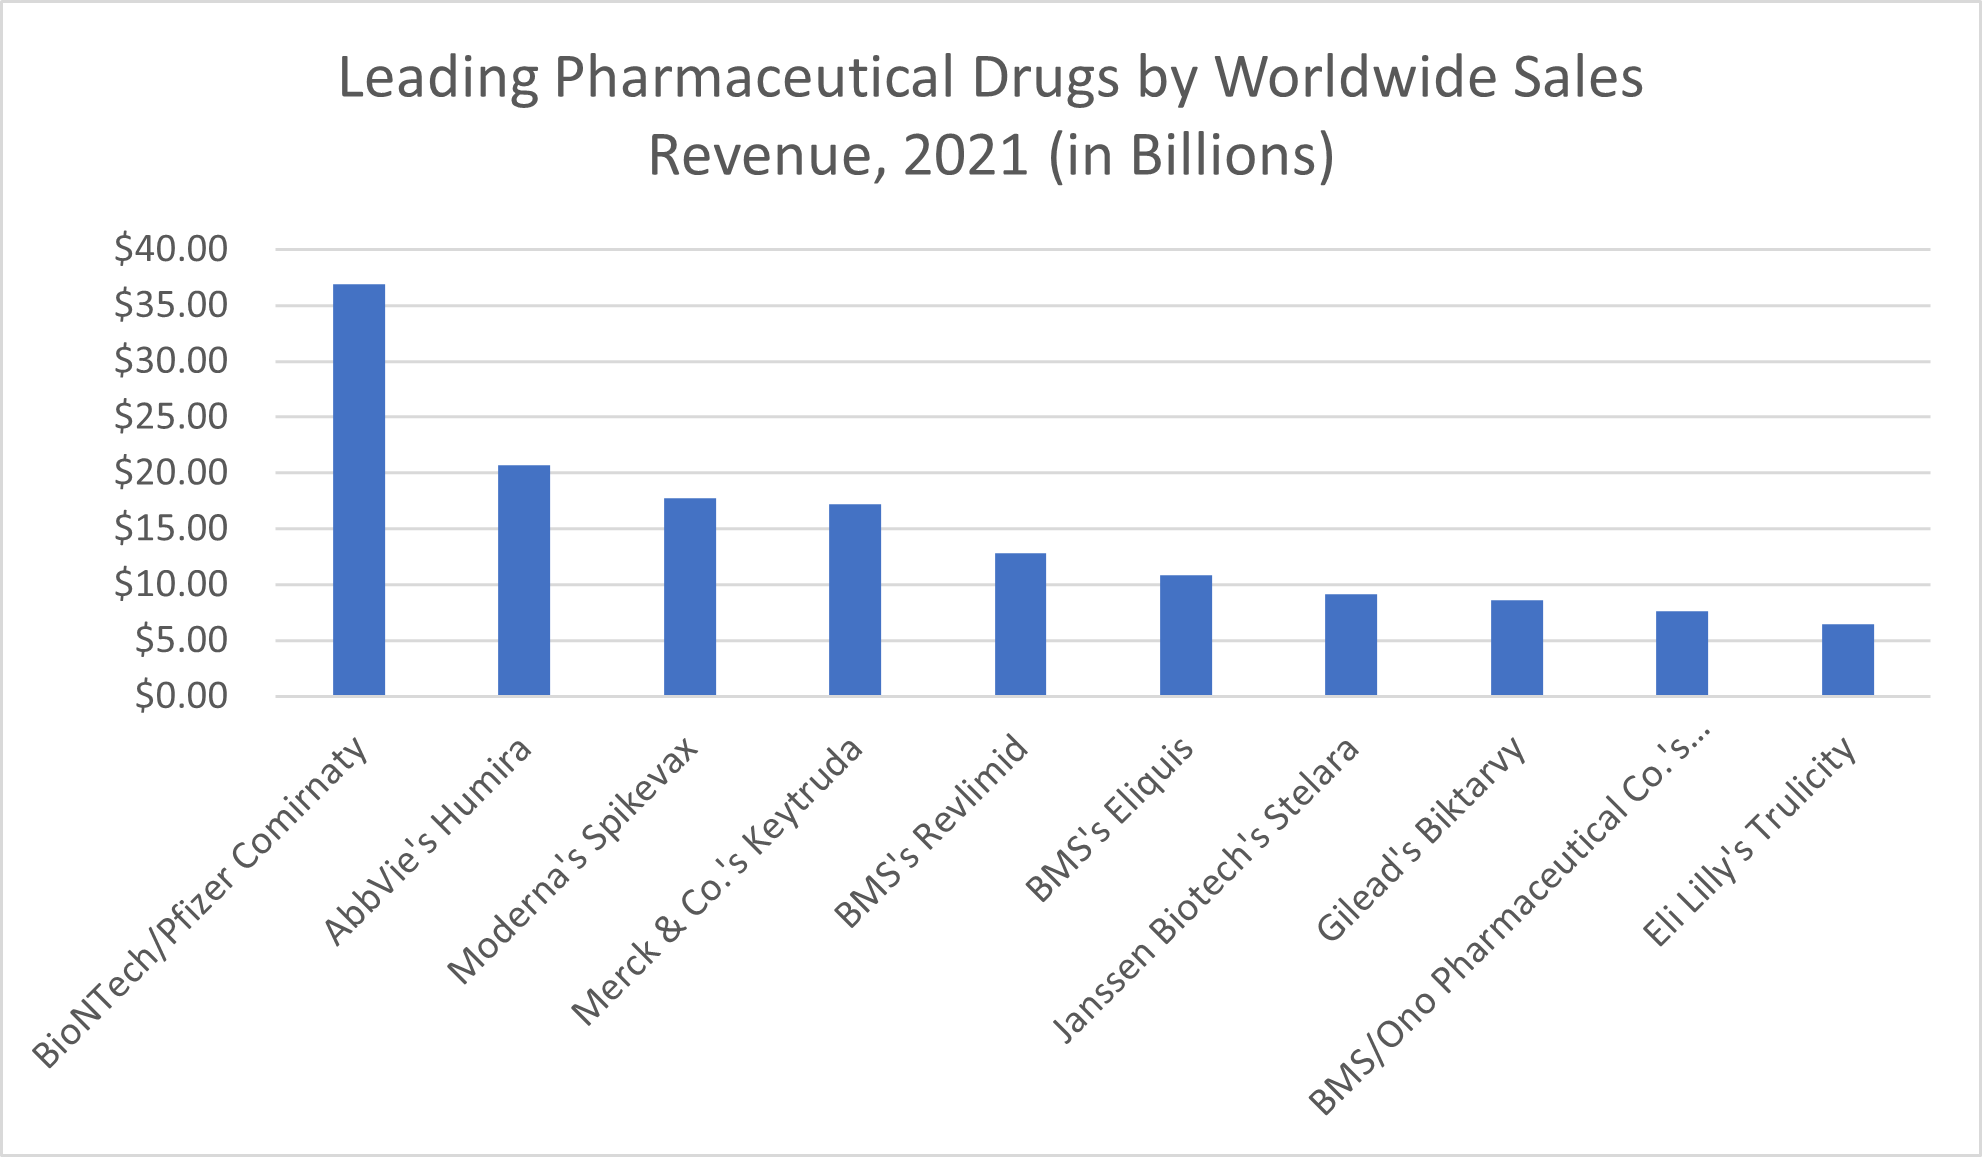
Drugs by Bristol Myers Squibb claimed the next two spots. Revlimid, a multiple myeloma treatment, achieved $12.8 billion in worldwide sales in 2021, while blood thinner Eliquis brought in $10.8 billion.
Janssen Biotech’s Crohn’s disease medication Stelara brought in $9.1 billion worldwide in 2021, followed by Gilead’s HIV/AIDS treatment Biktarvy, which made the company $8.6 billion.
BMS and Ono Pharmaceutical Co.’s cancer treatment Opdivo brought in $7.6 billion worldwide. Eli Lilly’s diabetes medication Trulicity rounded out the top 10 leading pharmaceutical products with $6.5 billion in worldwide sales in 2021.
What the Leading Pharmaceutical Drugs Tell Us About Pharmaceutical Industry Demographics
Seeing which drugs are bringing in the most money worldwide gives us insights into who is buying what pharmaceutical products. For example, the non-COVID vaccine pharmaceutical product that brought in the most money worldwide in 2021 was the rheumatoid arthritis drug Humira. According to the CDC, women in their sixties are the demographic population most likely to suffer from the onset of rheumatoid arthritis—and, presumably, the population contributing the largest share of pharmaceutical spending on this medication.
Keytruda, the drug with the fourth-largest worldwide sales revenue in 2021, treats multiple kinds of cancer, including melanoma and non-small cell lung cancer. Fair skin and advanced age are risk factors for the skin cancer melanoma, which is more common in women among patients diagnosed before age 50 but more common in men among patients diagnosed after age 50, the American Cancer Society reported. For lung cancer (including non-small cell lung cancer), for which the average age of diagnosis is 70, the 65 and older demographic is driving sales revenue.
The drug with the fifth-largest worldwide revenue, Revlimid, treats multiple myeloma. Black males in their mid-60s are the ones most at risk for being diagnosed with multiple myeloma, Mayo Clinic reported.
Conclusion
Diving into the data presented in research articles can help us understand which populations are currently spending the most money on pharmaceutical drugs and help us predict the future of the pharmaceutical industry.
Pharmaceutical Research and Development and Drug Marketing
For major pharmaceutical companies like Merck and Co. and Johnson & Johnson, this data can help inform research and development efforts and sales and marketing campaigns. Understanding both their current most profitable demographics and the untapped markets for whom new treatments could translate to more sales revenue can help pharmaceutical companies decide what new treatments to focus on in research and development and craft marketing messages that resonate with the patients who are most likely to bring in sales revenue.
Implications for Health Care, Scientific Research, Policymaking, and More
It isn’t only the pharmaceutical companies that benefit from better understanding the demographics of pharmaceutical industry sales. Public health officials and organizations that want to better understand health disparities and obstacles to good health can benefit from analyzing the factors that contribute to patient populations’ need for and access to medicines.
Healthcare administrators can use this knowledge to ensure that their facilities take action to combat the biases that contribute to health disparities and to find ways to better assist uninsured and other underserved patients.
By understanding current hot topics in the pharmaceutical industry and gaps in current treatments for health needs, aspiring scientists interested in working in pharmaceutical research and development can focus their research and education on the development of drugs for which the future demand is expected to be strong.
Lawmakers and policymakers can use what they learn from this data to inform the development of health regulation, legislation, and programs that support pharmaceutical research and development. Similarly, scholars and students of sociology and advocates for social justice may learn a great deal about the social factors involved in public health matters like access to care and risk factors for medical conditions.
Investors—ranging from major companies to individuals choosing their retirement plan allocations—who better understand the growth rate and demographics involved in the pharmaceutical industry can make more informed choices about how they want to invest their money.
Whatever the reason for your interest in the demographics of the populations that lead pharmaceutical industry sales, the data itself provides critical insights but doesn’t tell the whole story.
In complex real-world matters like health care access and usage, there are numerous factors—like gender roles and racial health disparities—and chains of events—like prohibitive costs keeping certain populations from going to the doctor, systemic inequality that perpetuates poverty conditions among minority groups and makes medication unaffordable, and social norms that discourage men from seeking help for their ailments—that give rise to quantifiable data. By looking at numerous related statistics, we can begin to piece together the larger story and understand how to address the causes and effects of demographic differences in pharmaceutical drug use from every angle.