
You might say that credit card debt is the American way. Most Americans have some amount of credit card debt. In fact, more than 50% of Americans who took part in a survey published in February 2023 reported having credit card debt in the range of $1,000 to more than $10,000, according to GoBankingRates.
As entrenched in the American economy as credit cards—and credit card debt—has become, it wasn’t always this way. The first real credit card as we know it only came into existence in 1950.
How did the current credit card industry become so massive and so ubiquitous in such a relatively short span of time? To understand the history and evolution of credit card debt in America, we need to go back to the beginning.
A History of Credit and Debt in America: A Summary
The practice of making purchases on credit dates back hundreds, if not thousands, of years.
Ancient civilizations recorded the very oldest instances of business transactions in which the purchaser promised to pay after the fact, according to Forbes. In the late 1800s, WalletHub reported, it became common for repeat, trusted customers to make purchases with credit—but these arrangements were negotiated on a case-by-case basis with individual vendors, each of whom acted as lenders. First-time customers couldn’t walk into a store owned by someone they didn’t know personally and expect them to accept payment by credit, as a cardholder can today.
A lot transpired between the earliest purchases made on credit and the modern usage of credit card accounts. Major turning points occurred in the 1930s, 1950s, 1980s, and 1990s, as well as during the Great Recession that began in 2007 and the pandemic-era concerns that first emerged in America in 2020.
Consumer Credit Cards in the 1930s-1950s
When did consumer credit start? The earliest semblance of a consumer credit card dates back to 1930, when the Charga-plate bookkeeping system was established, according to Forbes.
Instead of issuing customers a new credit card (as we know them today), retailers using this system issued metal plates reminiscent of military “dog tags.” Individual department stores could issue these plates to customers, who could use them as credit accounts—but only at the issuing store, which acted as the lender. As such, customers who frequented multiple department stores and didn’t want to pay in cash would need separate plates for each store where they opened a Charga-plate credit account.
In 1946, Forbes reported, the first card system that could be used for purchases at multiple retailers was developed. Under the “Charg-It” system developed by John C. Biggins, customers of Flatbush National Bank of Brooklyn, NY, could use one card to pay for purchases with multiple retailers located within a two-square-block radius of the bank.
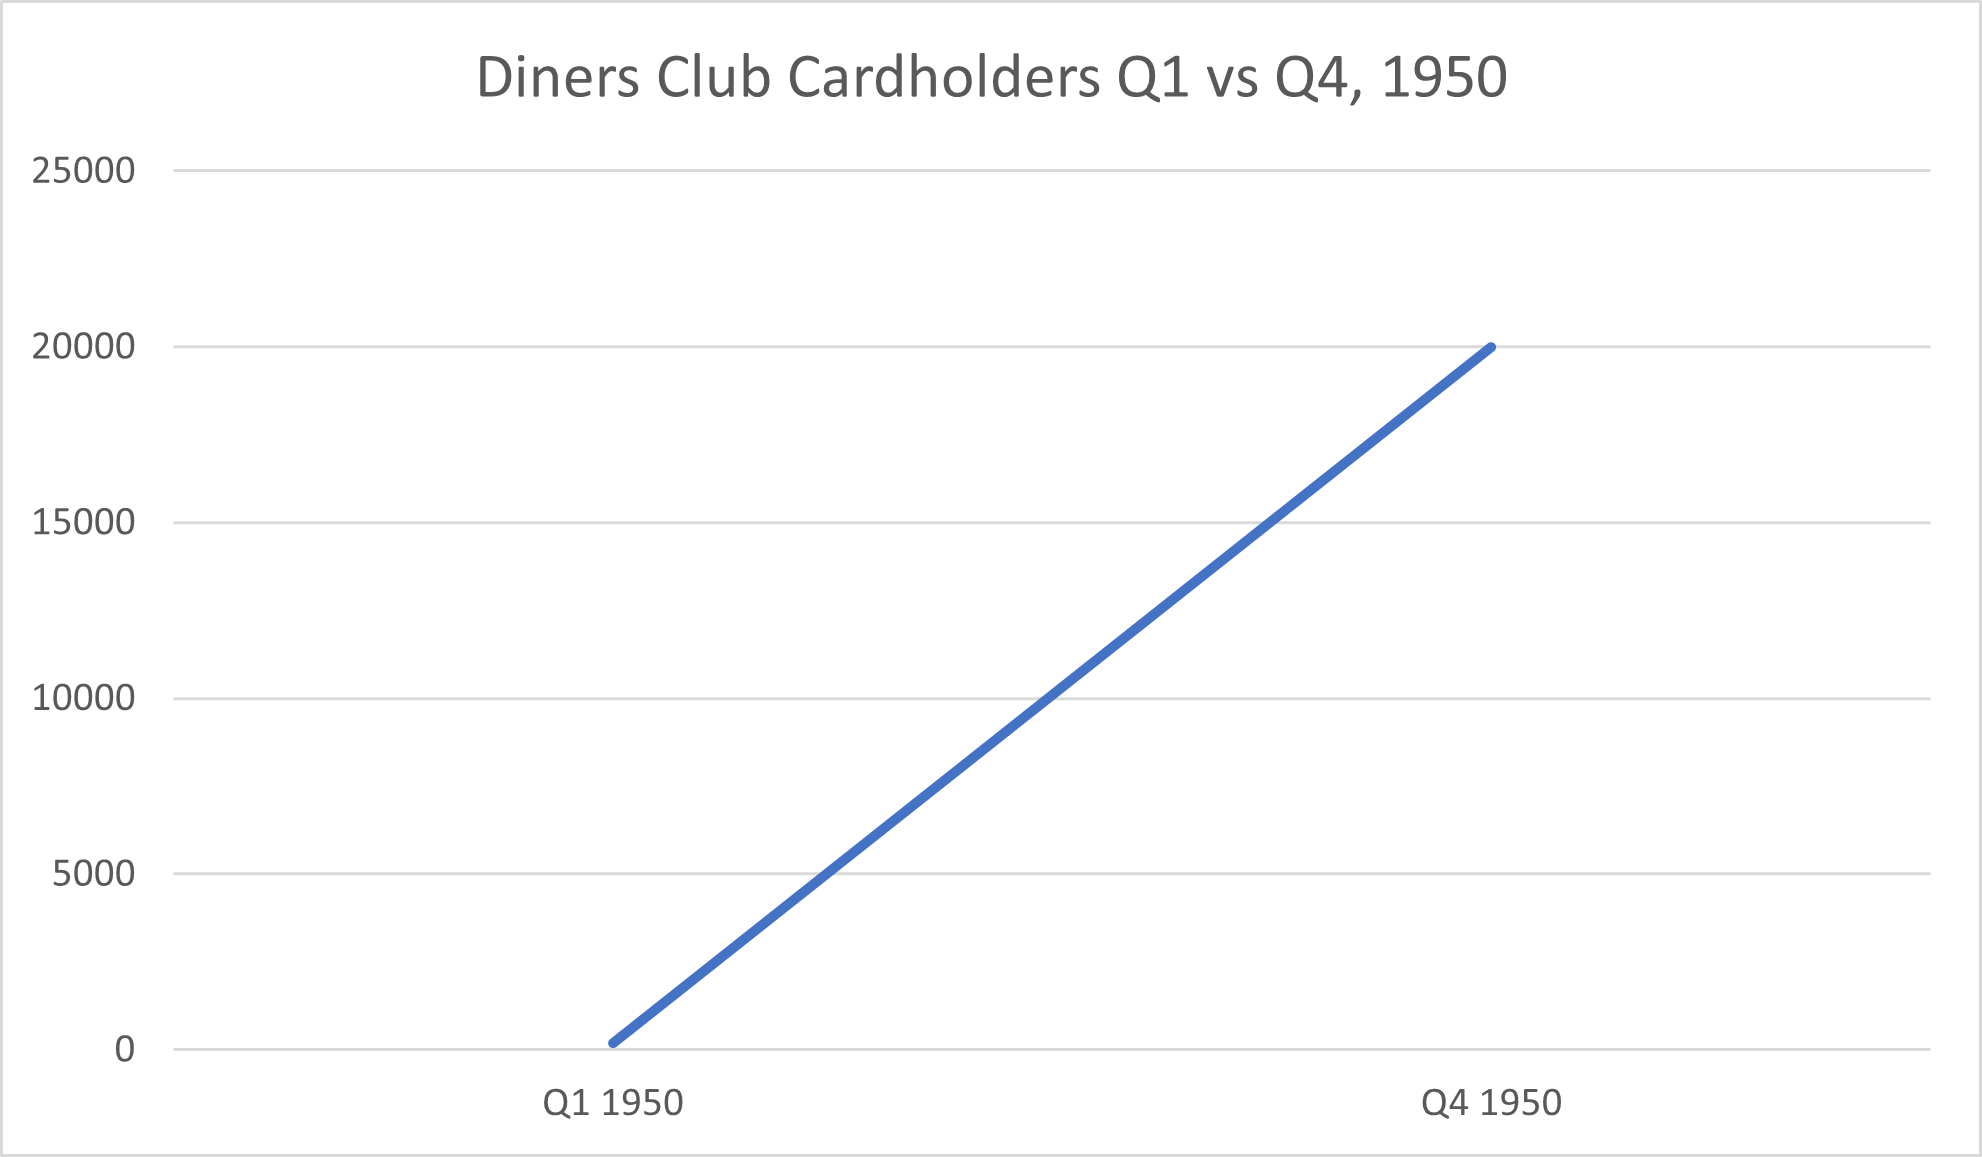
The Diners Club Card became “the world’s first multipurpose charge card” in 1950, according to Diners Club International. Invented by businessman Frank McNamara and introduced in collaboration with his partner Ralph Schneider, the Diners Club Card was originally, in fact, a card made of cardboard. Diners Club was the first charge account to bear the name “credit card” and was accepted by more than two dozen restaurants in New York City in its early days.
The first modern credit card quickly gained widespread popularity. The Diners Club started with just 200 users who were friends and acquaintances of the founders and grew to 20,000 users by the close of the fourth quarter of 1950. Before the end of 1951, 42,000 Americans used the Diners Club Card. By 1953, the Diners Club Card was being honored in restaurants in Canada, Mexico, the United Kingdom, and Cuba, qualifying it as “the first internationally accepted charge card,” Diners Club International reported.
Despite its popularity, the widespread adoption of the Diners Club Card didn’t generate credit card debt in the way we think of it today: debt that carries over month-to-month and which cardholders have to pay back at high interest rates. Diners Cardholders essentially used their card to charge their restaurant bills directly to the Club, but they would then have to pay the bill in full each month. This meant there were no long-term, revolving balances on these accounts.
Toward the end of the decade, though, the first cards that allowed cardholders to carry revolving credit card balances were established. In 1958, American Express issued the first bank cards. That same year, around 60,000 customers in the Fresno, California, area received BankAmericard credit cards from the Bank of America—the company that would later be known as VISA, Forbes reported. By 1959, consumers were racking up the first revolving credit card balances.
Growth of Consumer Credit Cards in the 1960s and 1970s
Now that consumer credit cards were more widely available—and, if you wanted to spread out payments over months, more useful by virtue of allowing for revolving balances—their popularity rose through the ’60s and ’70s.
By the mid-60s, just a decade and a half after it was founded, Diners Club had grown to 1.3 million cardholders. BankAmericard would begin expanding outside of California in 1966, while the unaffiliated banks in the state collaborated to form the Interbank Card Association (which would eventually become MasterCard), NerdWallet reported.
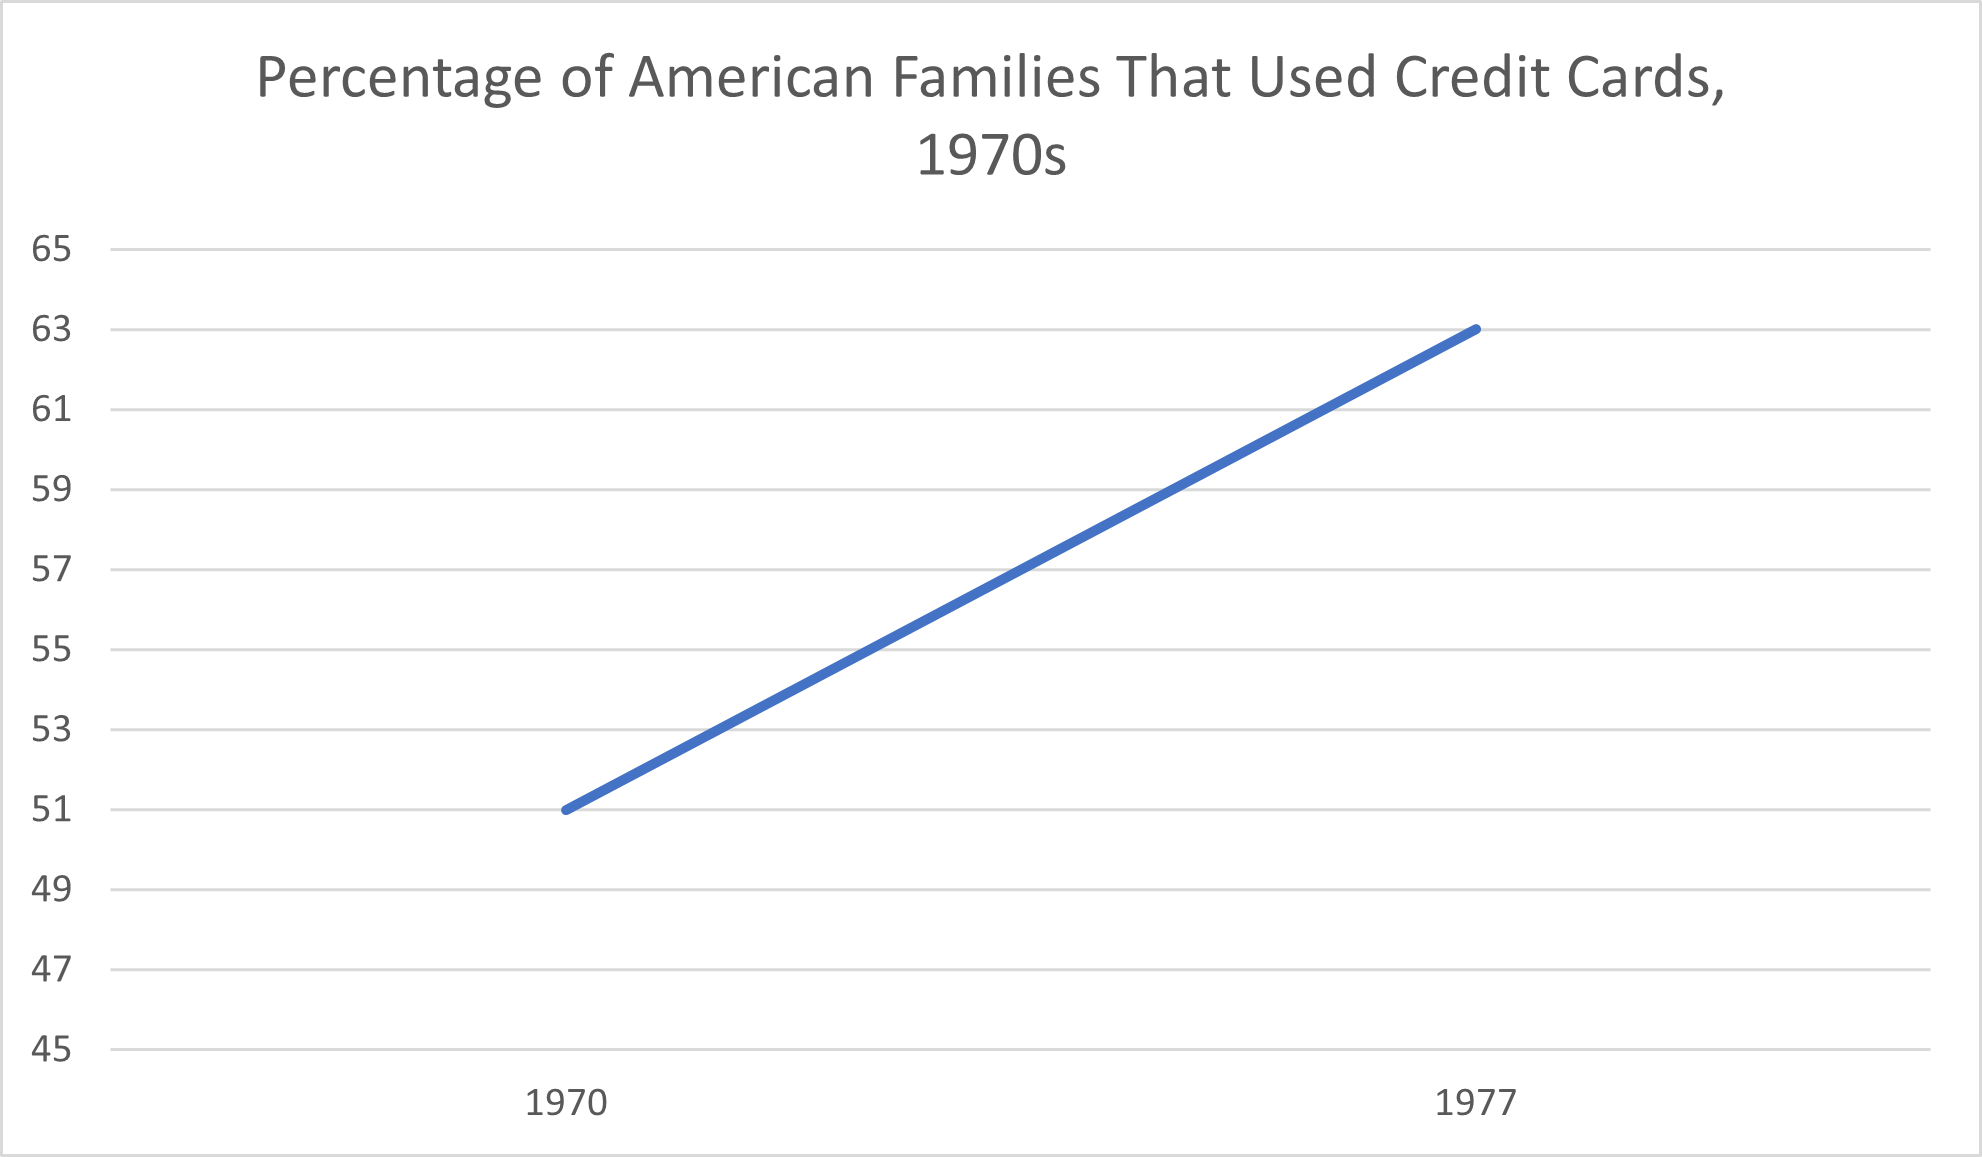
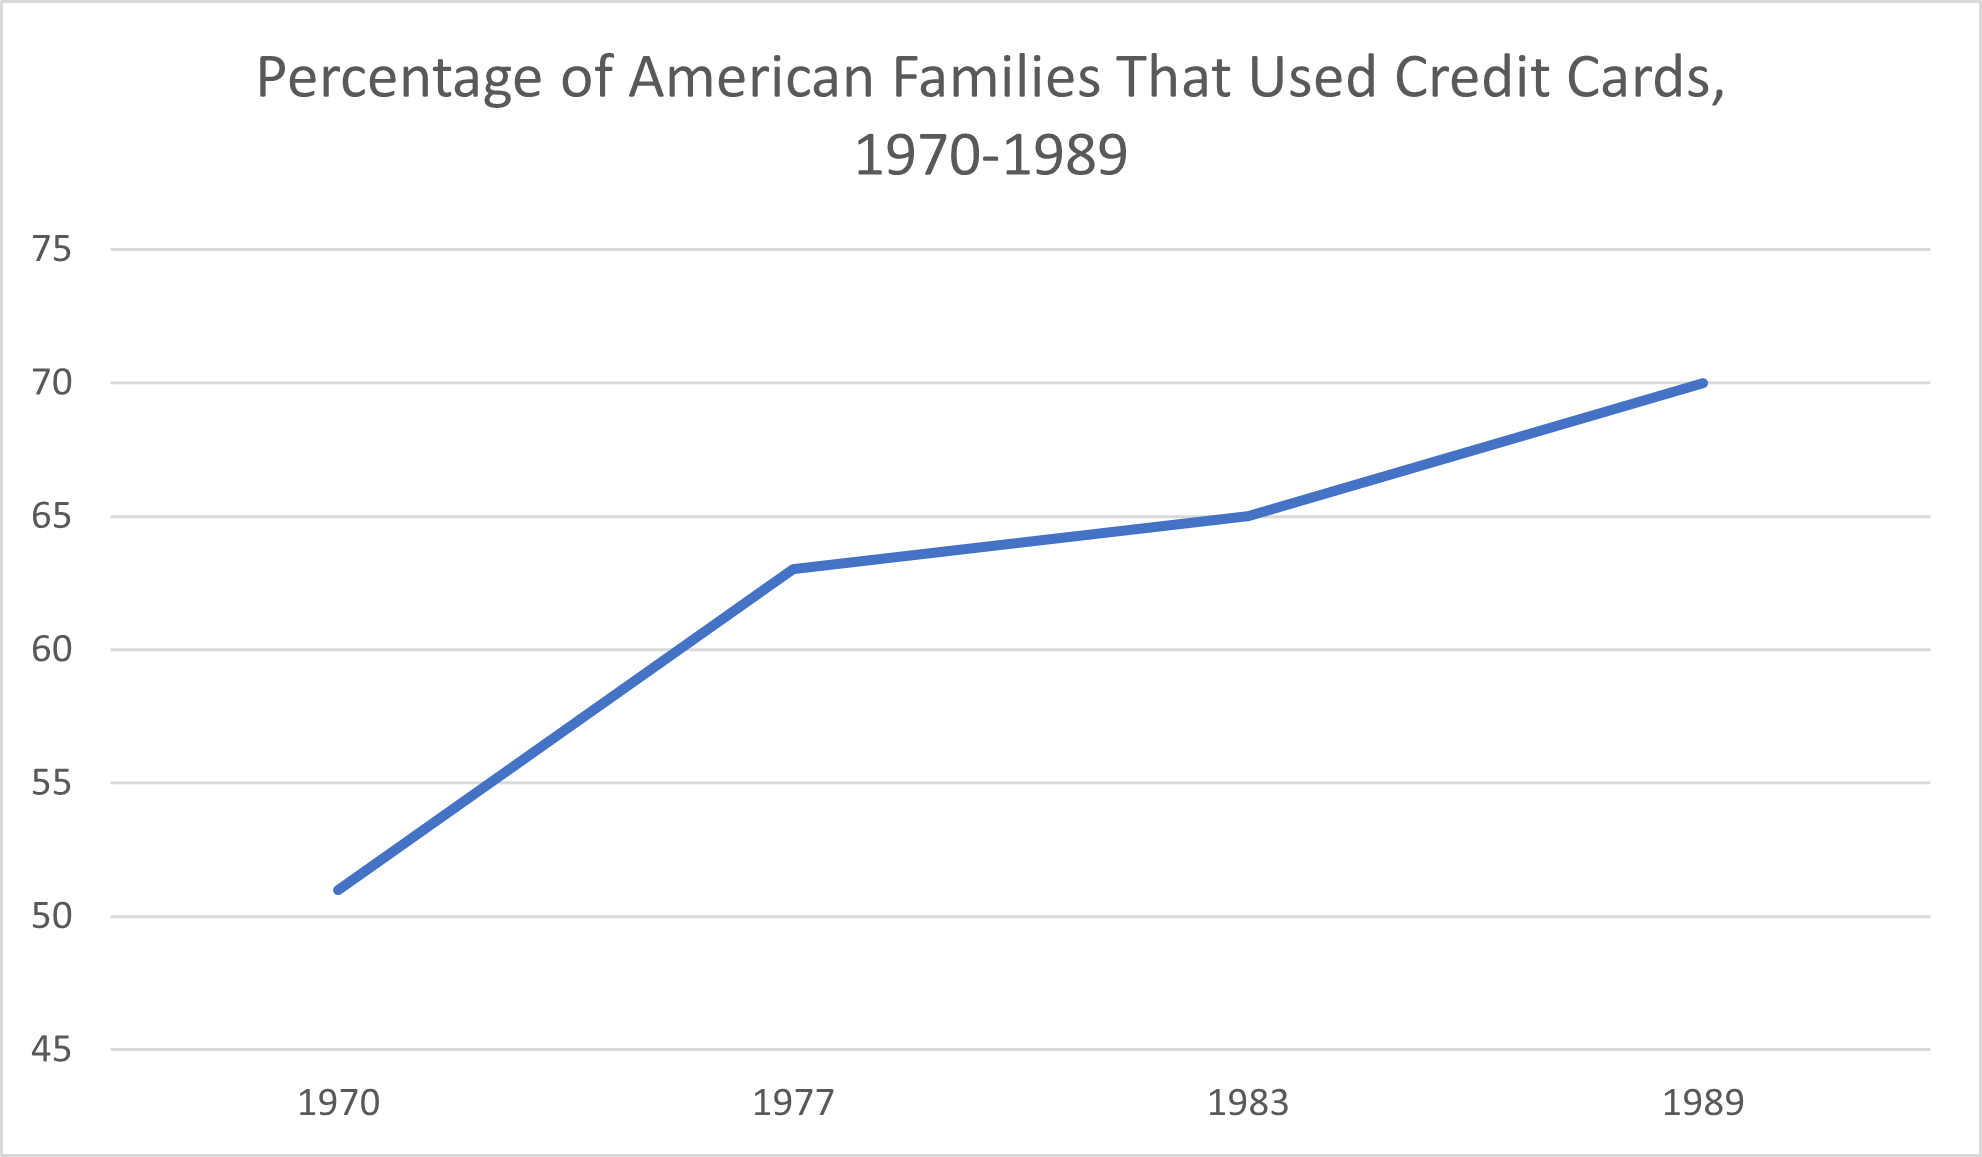
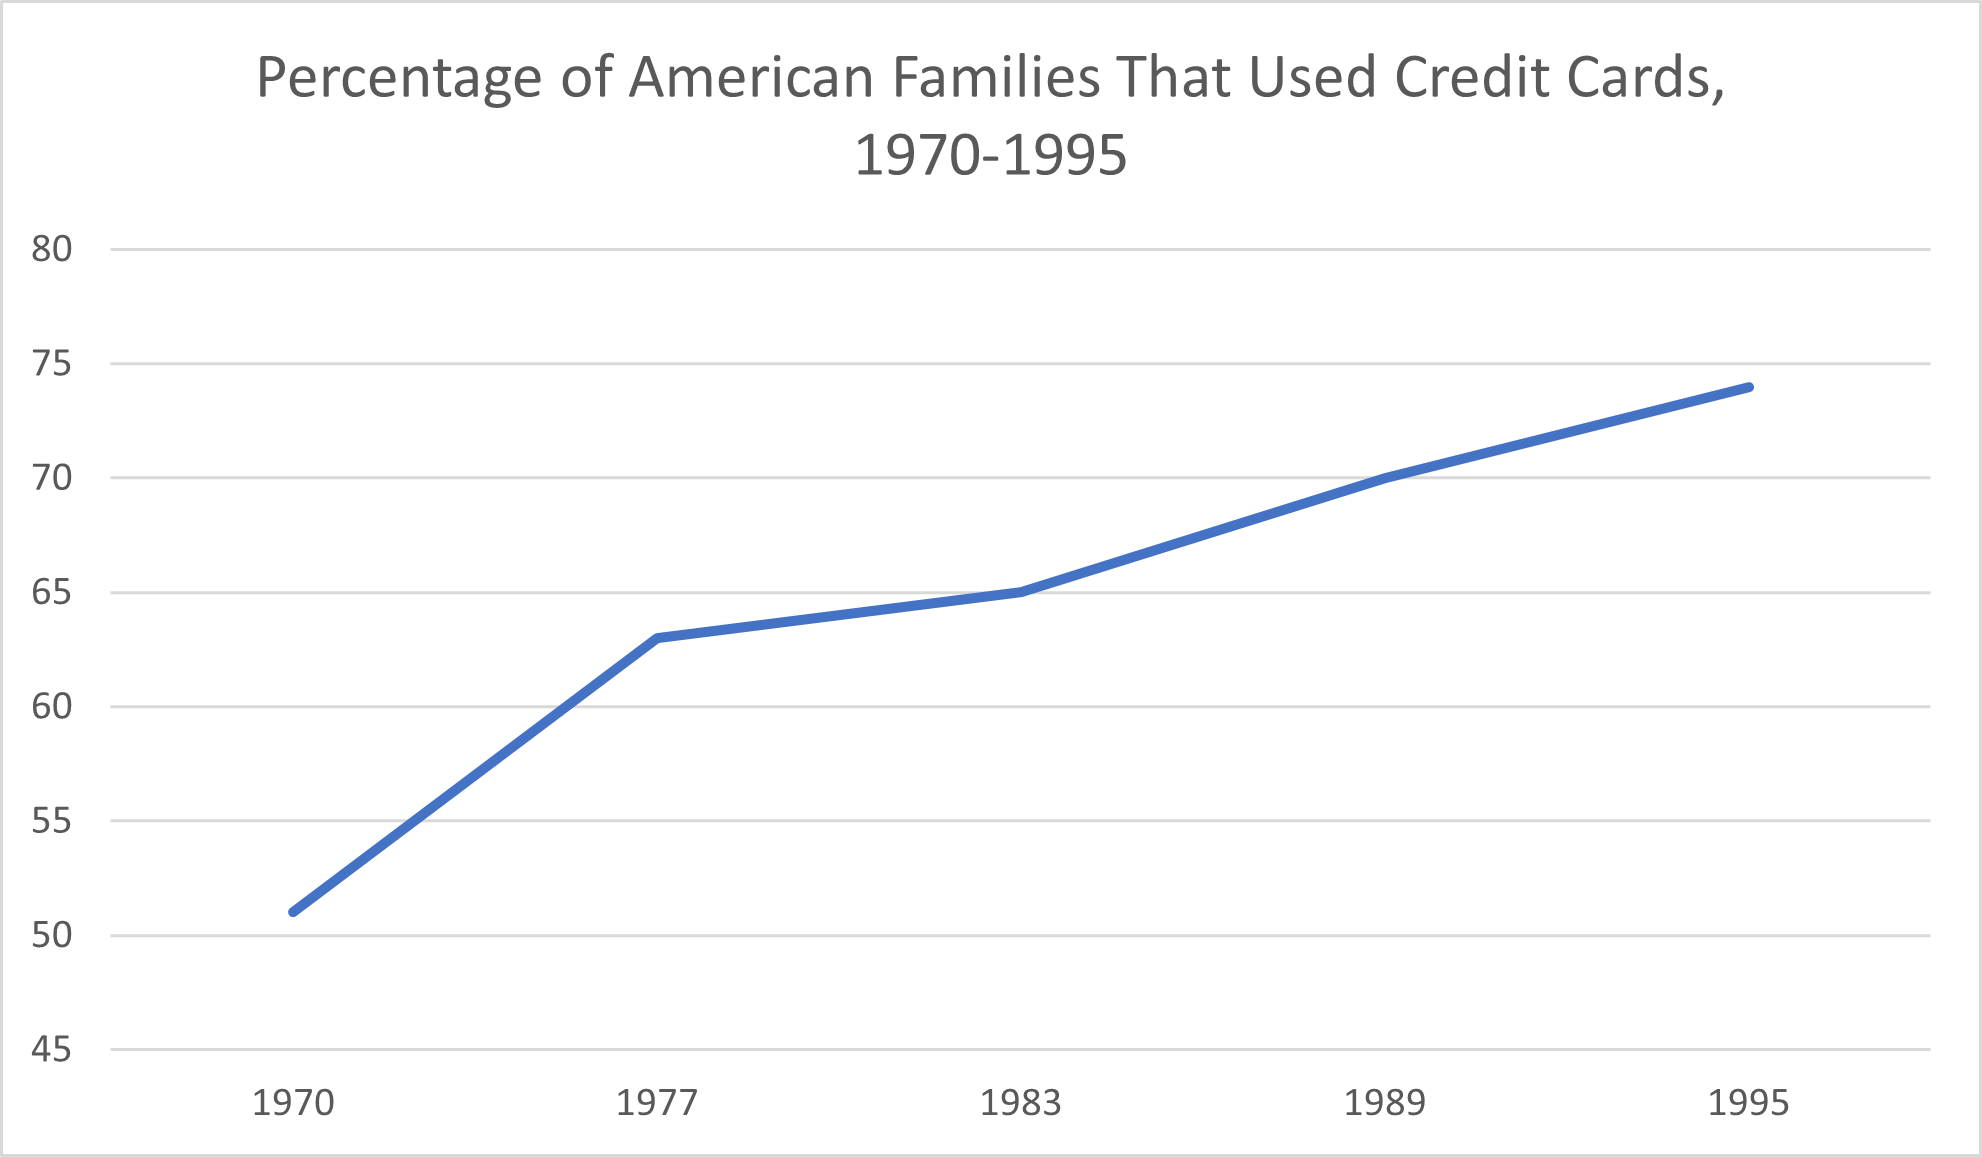
As credit card issuer companies expanded their networks to include more businesses in more geographical areas, the appeal of using credit cards for convenience increased. By 1970, 51% of American families surveyed reported having at least one credit card, according to a 2020 Federal Reserve Bulletin. That percentage climbed to 63 by 1977.
Increases in Credit Card Spending Through the 1980s
It was largely in the 1980s when it became commonplace for average Americans to borrow money—in the form of using credit cards—not to get through emergencies or as a more convenient method of paying than cash but instead to afford to live a middle-class lifestyle, the Smithsonian Insititute National Museum of American History reported. During this decade, according to the museum, “overall individual debt increased faster than income.”
This decade also gave rise to the first-ever cashback card in the United States. Retailer Sears launched the Discover card, enticing customers with the promise of small rebates on their purchases, in 1986, NerdWallet reported.
Just how popular were consumer credit cards among U.S. consumers in the ’80s? By 1983, 65% of Americans reported having a credit card, according to the Federal Reserve Bulletin. In 1989, the number of Americans who used credit cards rose to 70%.
More Americans Get Credit Cards During the 1990s
Credit cards that offered some sort of cash back or reward became more prevalent in the 1990s, according to WalletHub. This development contributed to more Americans embracing credit cards in their personal finance activities. Credit cards also become easier to get as issuers became more willing to offer lines of credit to customers perceived as riskier due to their credit history or income level—and to charge them higher interest rates, according to U.S. News & World Report.
According to the Federal Reserve Bulletin, 74% of Americans reported using credit cards in 1995.
Changes in Credit Card Quantities and Debt Throughout the 2000s
The 2000s gave rise to a major turning point in American credit card balances: the Great Recession. Amidst financial uncertainty the likes of which the public hadn’t seen since the Great Depression, Americans—and especially younger Americans—became “less likely to hold credit card debt,” the U.S. Census Bureau reported.
Still, credit card payments weren’t going anywhere, especially as online shopping gained popularity. The average number of credit cards American consumers had as of the end of 2008 was 3.5, according to Nasdaq, Inc.
Credit Card Accounts Grow Through the 2010s and Beyond
By January 2010, the credit card industry continues to grow and the American consumers collectively had 609.8 million credit cards, Nasdaq reported. That number would climb to 1.12 billion in 2018, according to WalletHub, and is projected to exceed 1.25 billion by the end of 2023.
Consumer Credit Balances Throughout History (as Reported by the Federal Reserve Bank)
The Board of Governors of the Federal Reserve System has maintained records of outstanding consumer credit balances monthly since January 1943 through the present. This data includes “all major types of credit,” not merely general-purpose consumer credit cards, but all the same, it gives us unique insights into how consumer credit debt in general has progressed over time.
Consumer Credit Debt Statistics in the 1940s and 1950s
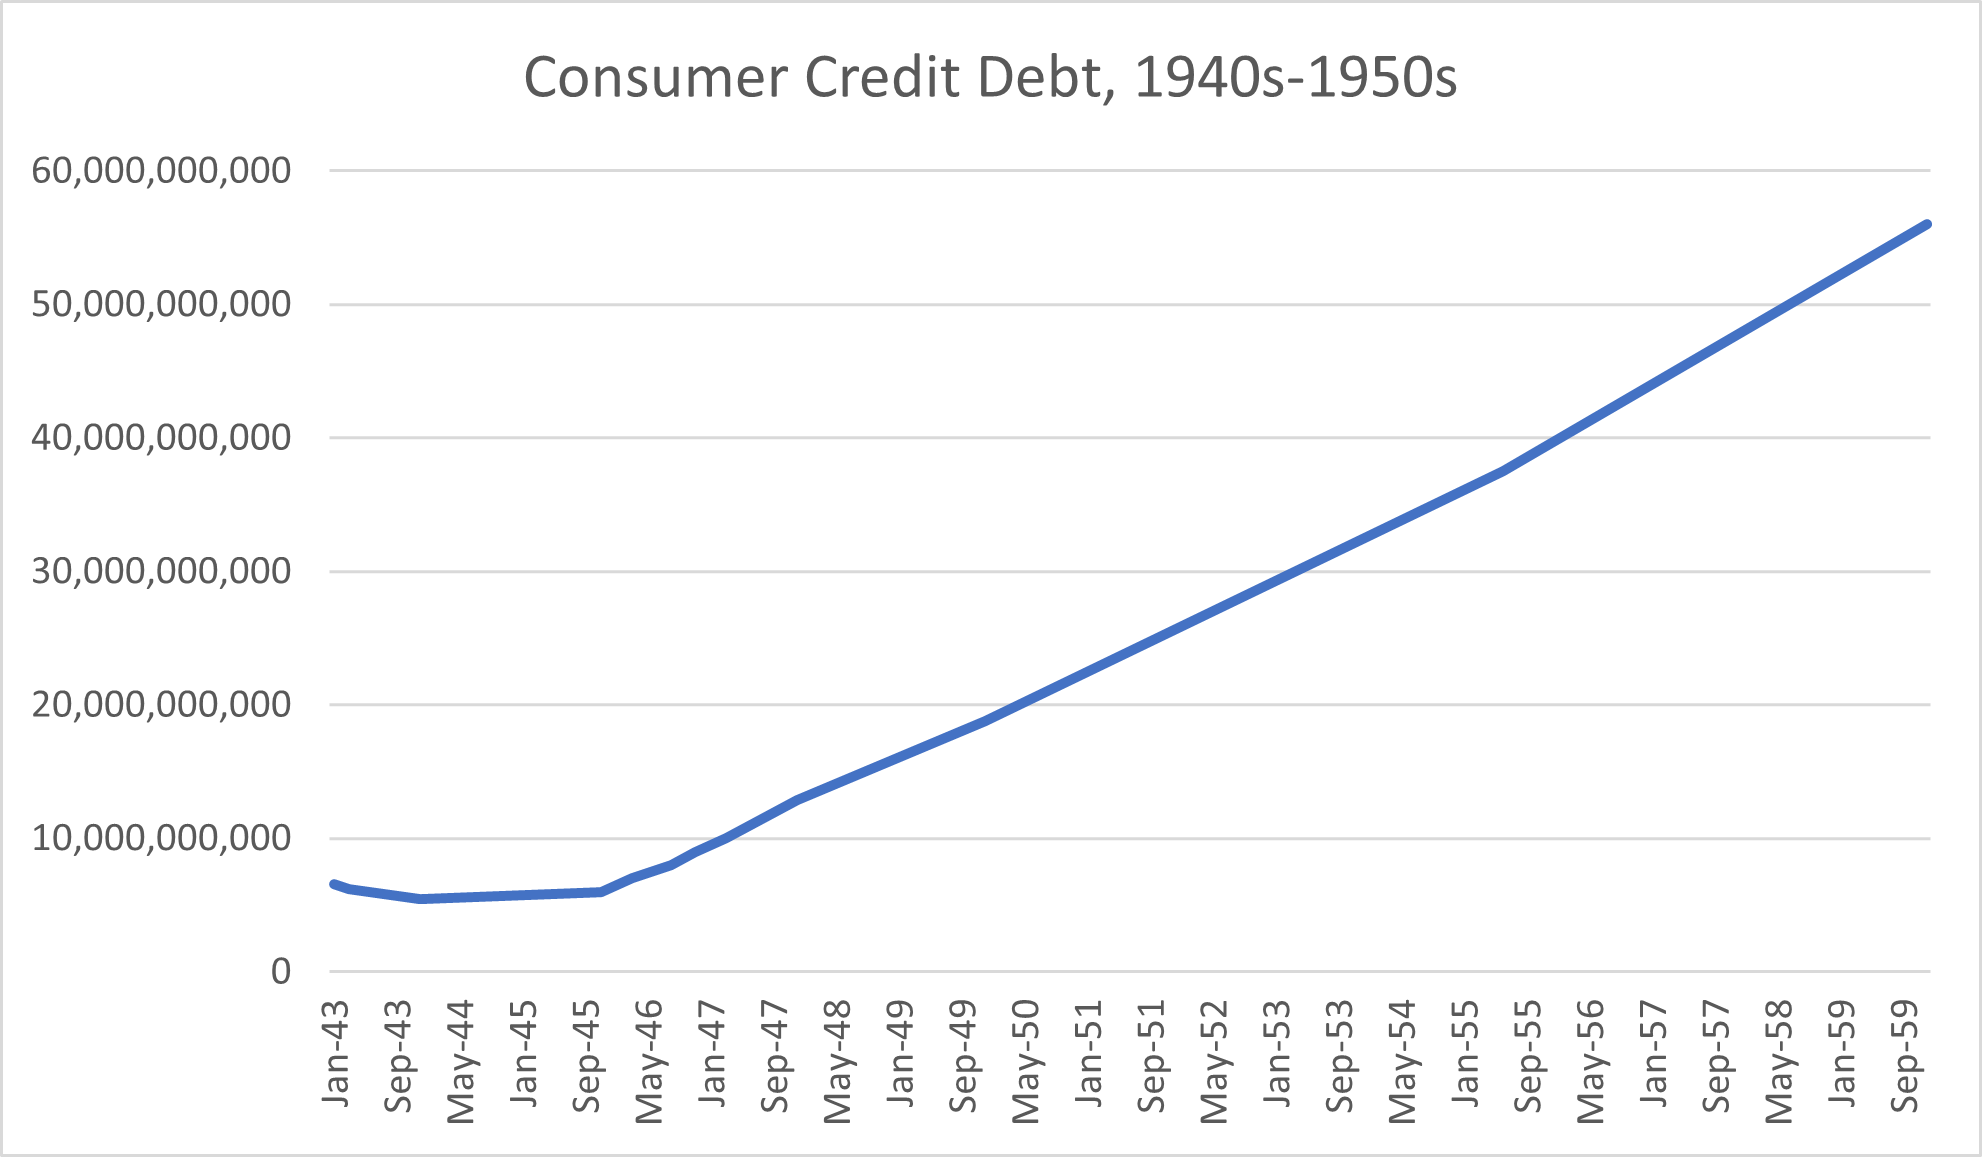
In January 1943, according to the credit card debt statistics, the total amount of seasonally adjusted outstanding consumer credit in America reached $6,577,830,000. Over the first quarter of the year, that balance declined, finishing at $6,234,210,000 by March 1943. Outstanding credit balances continued to decline throughout the second quarter and most of the third quarter. The fourth quarter of the year ended with an outstanding consumer credit balance of $5,462,520,000 in December of 1943.
Outstanding consumer credit balances remained below $6,000,000,000 until November of 1945, then climbed fairly consistently over the following years. By March 1946, total outstanding consumer credit balances exceeded $7,000,000,000. It only took until August for this balance to surpass $8,000,000,000. November 1946 marked the first time outstanding consumer credit climbed above $9,000,000,000—a record high at that time.
In the first quarter of 1947, American consumers carried credit debt of more than $10,000,000,000. The close of the fourth quarter of 1947 would see this balance rise to $12,855,620,000.
By the end of the decade, outstanding consumer credit balances reached a high of $18,772,210,000. It would only take until June of 1955 for this consumer debt amount to double. December of 1959 saw consumers carrying a (then) record high level of outstanding credit balances, at $56,010,680,000.
How Consumer Credit Balances Grew Through the ’60s and ’70s
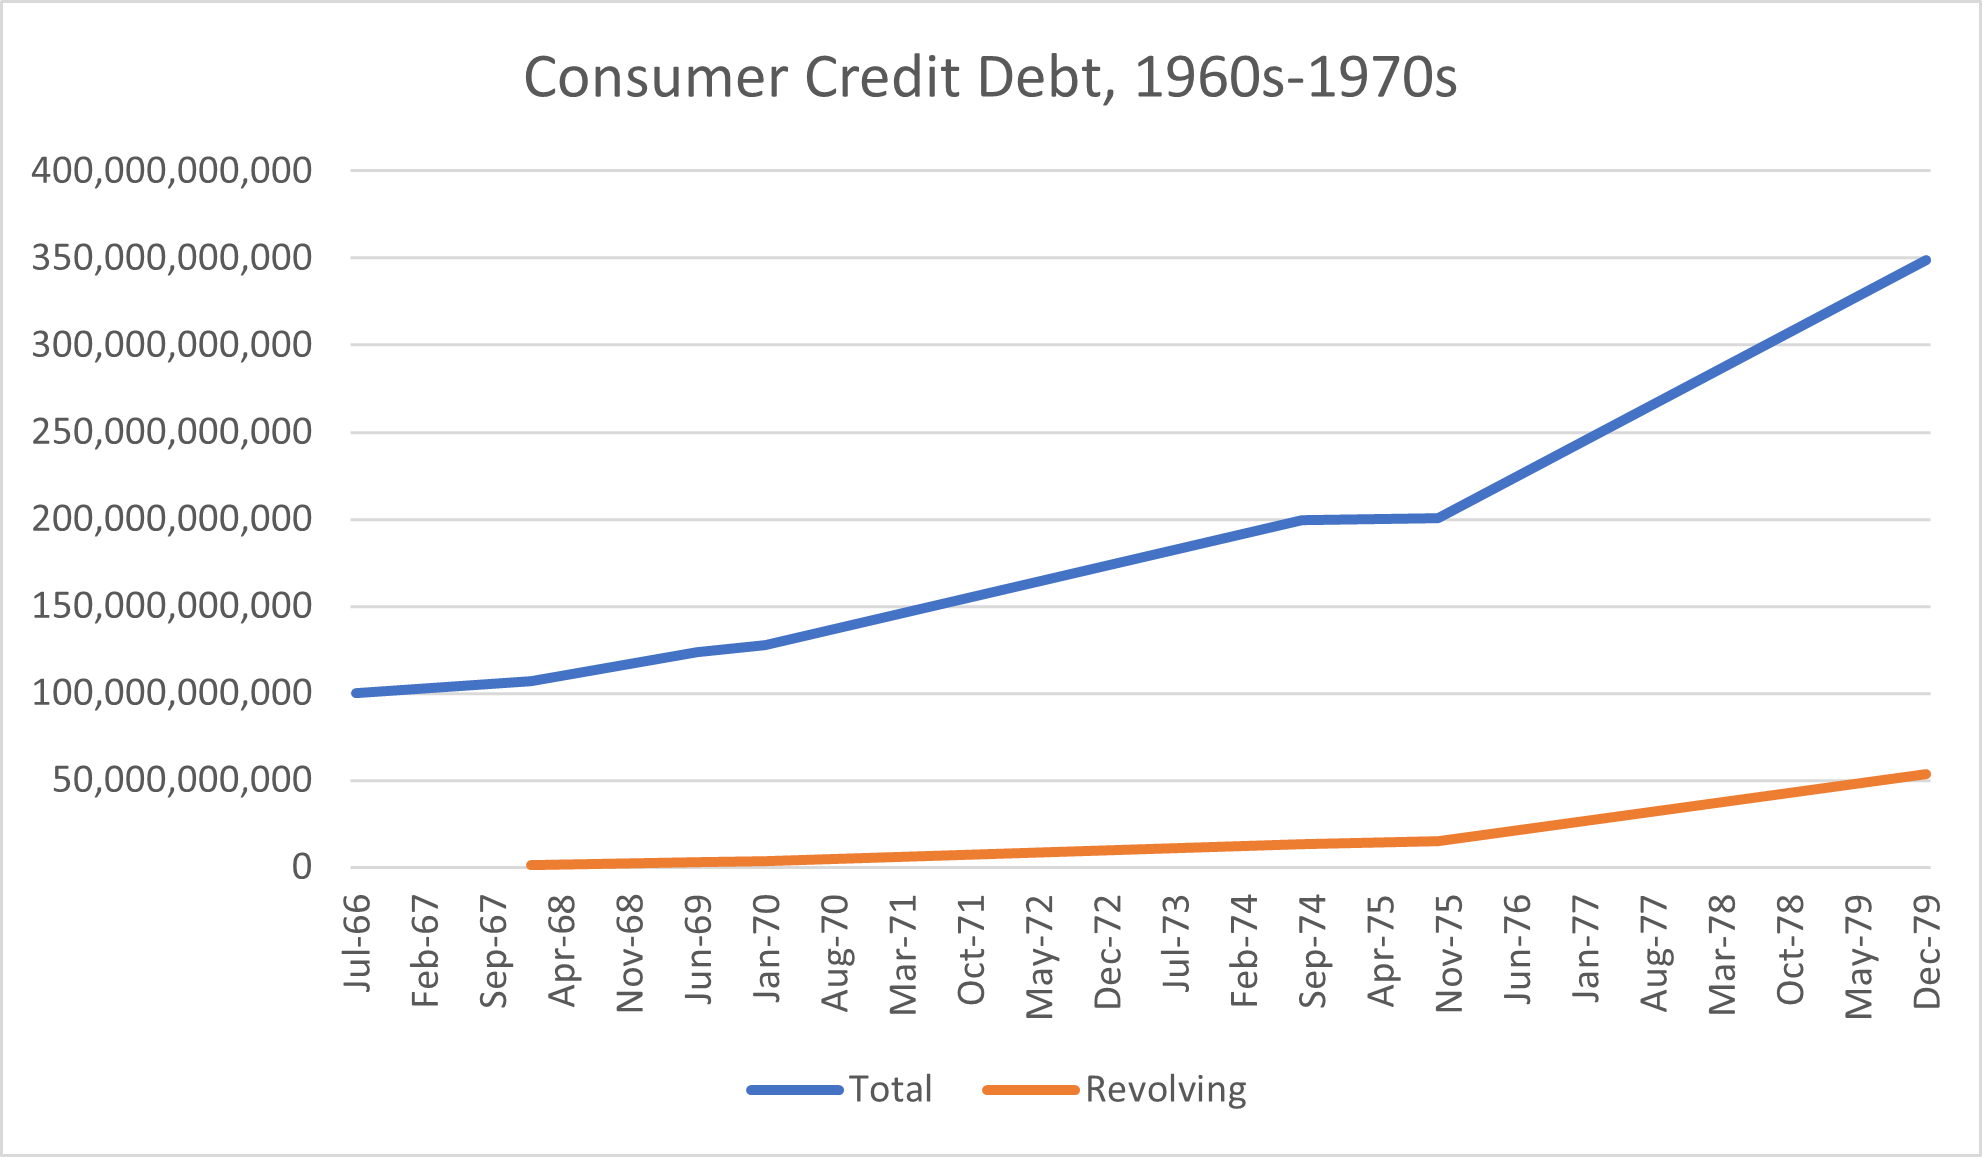
Consumer credit balances would continue to rise throughout the ’60s, breaking the $100,000,000,000 mark by July of 1966. In January 1968, the Board of Governors of the Federal Reserve System reported a revolving balance total for the first time. That figure, too, would see sharp rates of growth, doubling from $1,316,770,000 in January 1968 to $2,727,960,000 by June 1969. At this time, revolving debt accounted for around 2.2% of the total outstanding consumer credit balance in America.
Consumer credit debt hit $127,802,990,000 in January 1970, $3,693,210,000 of which was revolving debt. By that time, revolving debt accounted for nearly 3% of the total consumer credit balance. In the second half of 1974, total consumer credit debt hit $199,316,800,000—but it wasn’t until over a year later that consumer credit debt broke the $200,000,000,000 threshold. By this time, revolving debt had climbed to $14,811,040,000, accounting for over 7% of total outstanding consumer credit debt. By the close of the decade, the total outstanding debt American consumers were carrying reached $348,589,410,000. Of that amount, $53,596,430,000—more than 15%—was revolving debt.
Credit Debt and Revolving Balances Explode in the ’80s
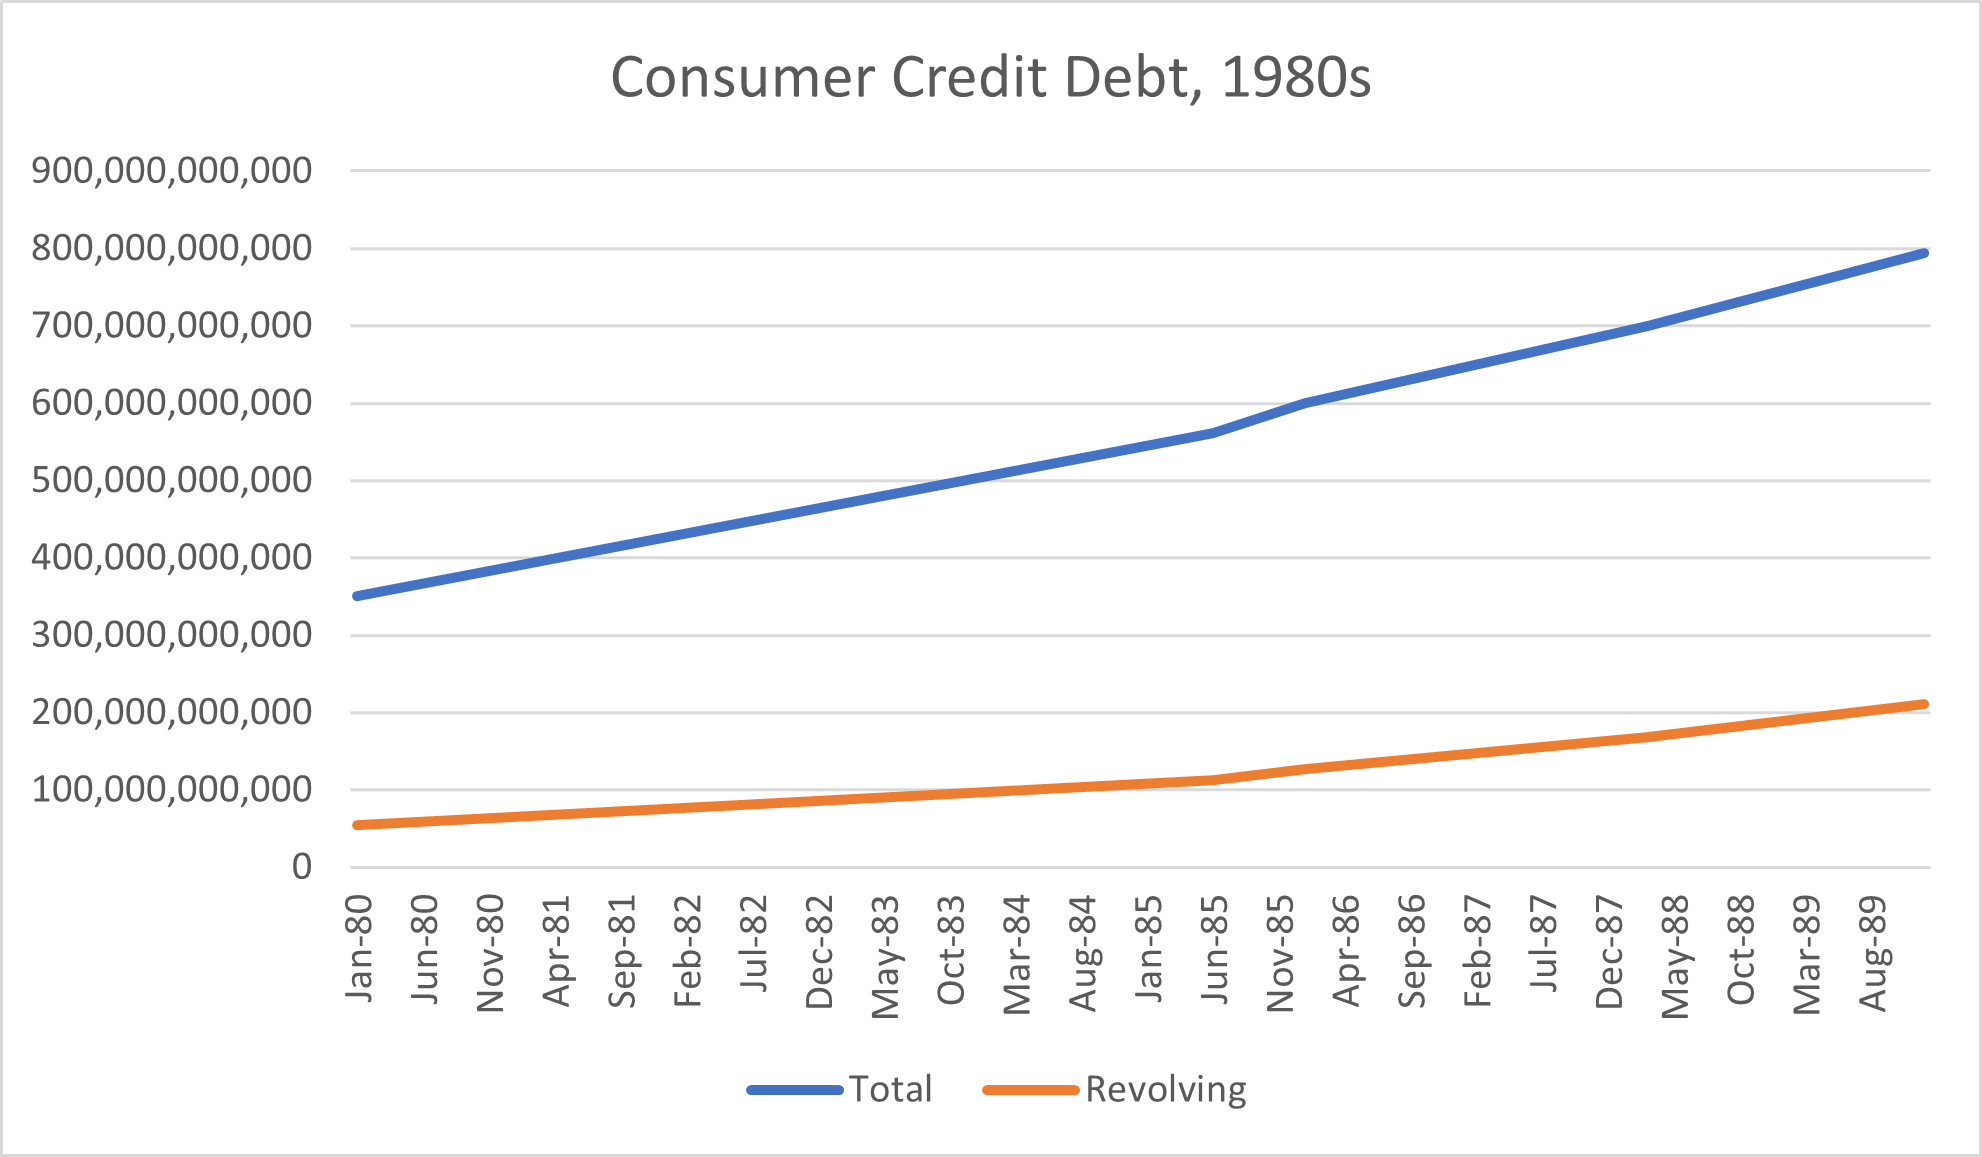
As of January 1980, total outstanding consumer credit debt amounted to $350,056,230,000, $54,749,770,000 (or 15.6%) of which was revolving debt. The mid-80s saw both numbers climb ever higher. In June 1985, when the total outstanding consumer credit balance reached $561,206,600,000, revolving debt accounted for $112,395,480,000 (or 20%) of that amount.
Total consumer credit balances exceeded $600,000,000,000 by January 1986 and $700,000,000,000 by March 1988. In December 1989, Americans owed a total of $794,612,180,000 in total outstanding credit balances. The collective revolving balance of $211,229,830,000 amounted to nearly 26.6% of total American credit debt.
Record-High Revolving Balance Percentages of Total Consumer Credit Characterize the ’90s
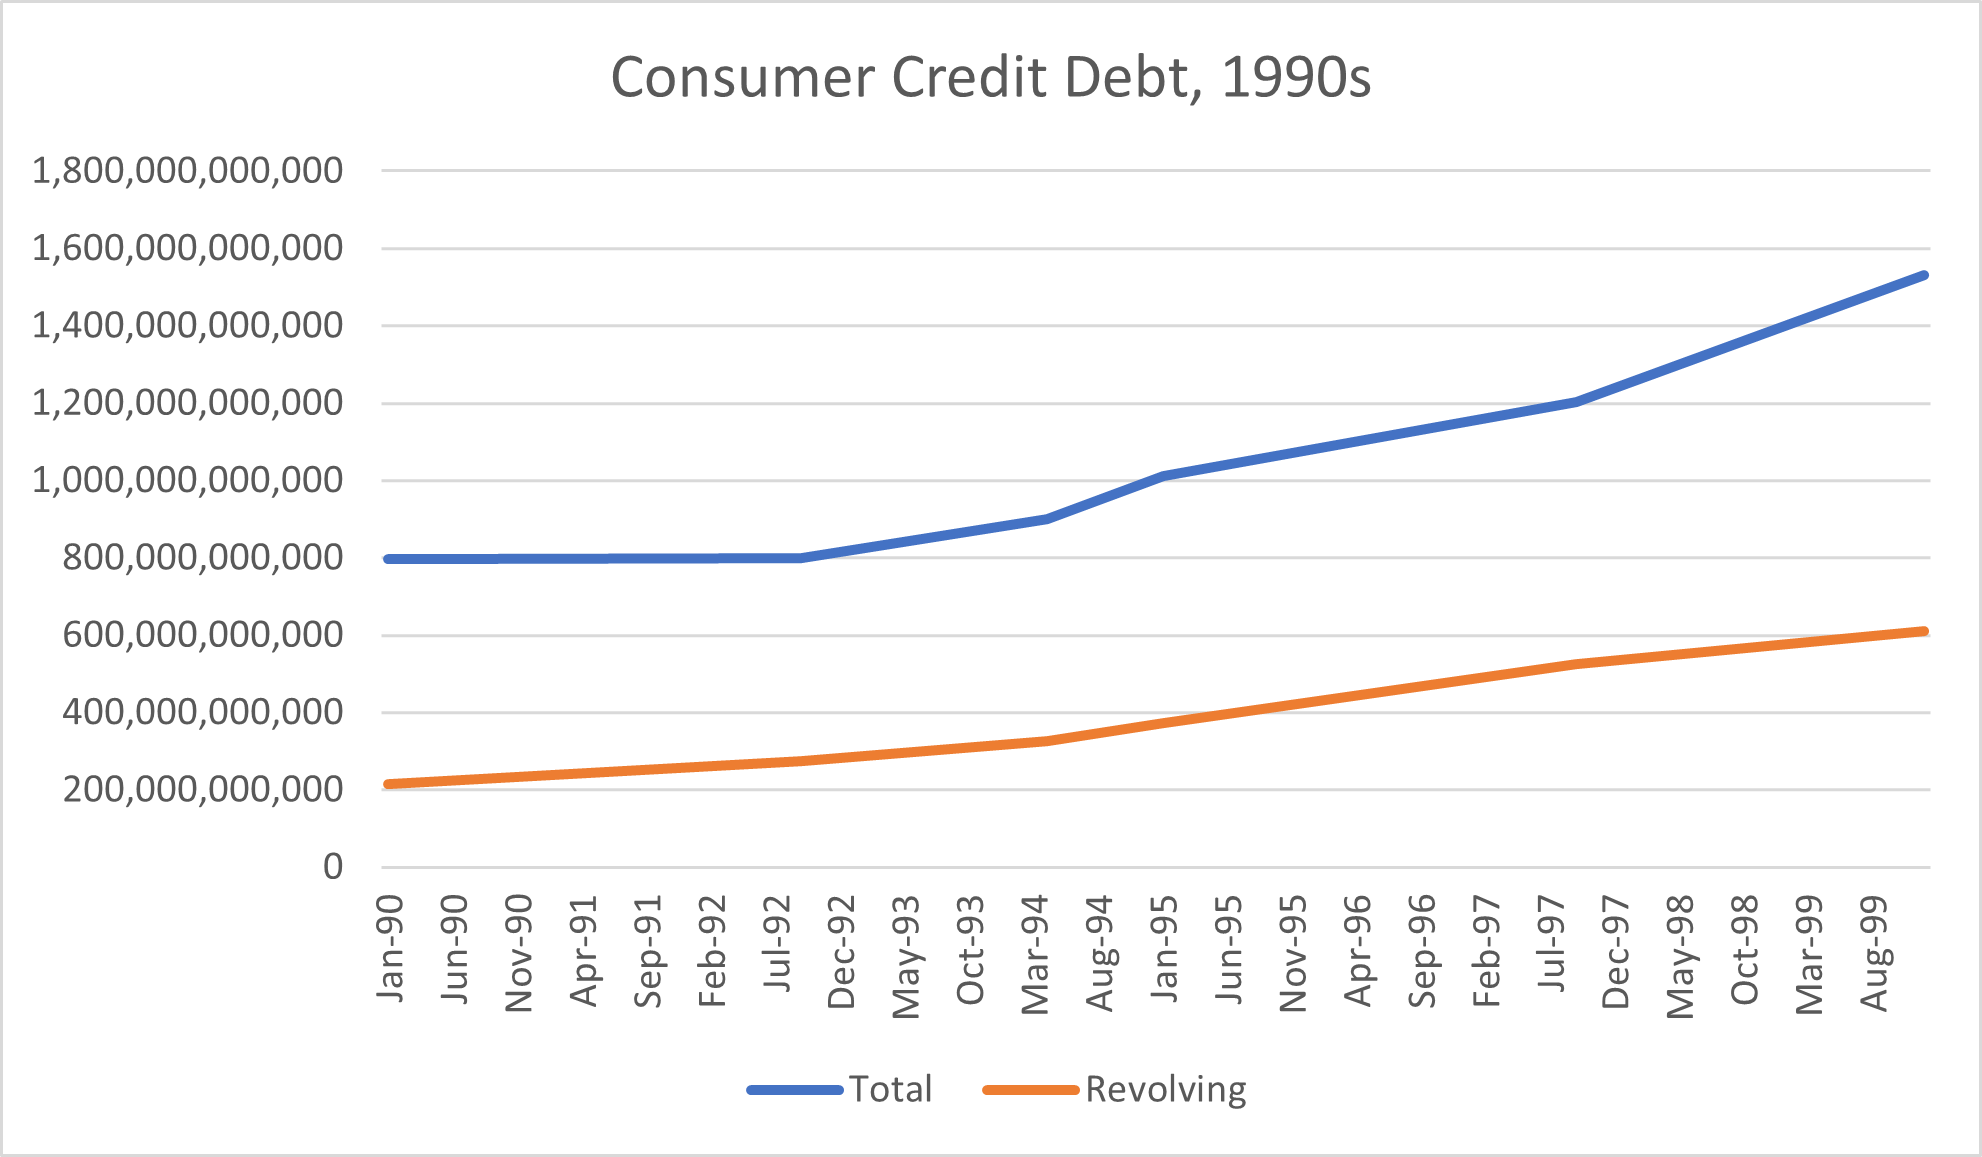
The 90s kicked off with total outstanding consumer debt approaching the $800,000,000,000 mark and revolving debt well into the $213,000,000,000 range. In September 1992, when total outstanding consumer credit debt topped $800,198,900,000, revolving debt accounted for more than a third of total debt, at $273,176,960,000.
By April 1994, total debt had climbed to $900,989,530,000, more than 36% of which—$325,015,740,000 in all—consisted of revolving debt. The total outstanding consumer credit balance first exceeded $1,000,000,000,000 in January 1995, when revolving debt constituted $372,003,170,000 (or 36.8%) of that balance.
As consumers’ collective credit revolving debt climbed into the $500,000,000,000 range, the percentage of the total outstanding consumer credit debt that revolving balances made up exceeded 40%. In September of 1997, consumers owed a collective $1,201,634,970,000, and $524,444,780,000 (or 40.5%) of that debt was a revolving balance. The decade ended with a December 1999 total balance of $1,531,105,960,000 and a revolving balance of $610,696,470,000 (or 39.9% of the total).

Ups and Downs in Consumer Credit Balances During the 2000s
Total outstanding consumer credit debt doubled during the first decade of the new millennium, while revolving debt increased by around 150%. The first quarter of 2000 ended with a total consumer credit balance of $1,561,450,690,000—marking a substantial increase from the prior quarter—and a revolving balance of $614,846,550,000 (around 39.4% of the total). June 2005 saw outstanding consumer credit debt totals climb to $2,247,833,430,000, of which $814,908,460,000 (or around 36.3%) was revolving debt.
The Great Recession was a volatile time economically, and it influenced consumer credit balances as well as other aspects of the economy.
In December 2007, the start of the Great Recession, consumers owed a total of $2,609,476,530,000 in credit debt, $1,001,625,300,000 (or around 38.4%) of which was revolving debt. Total debt climbed through July of 2008, when it reached $2,665,321,260,000, $1,018,363,900,000 (or 38.2%) of which was revolving debt.
From there, outstanding consumer credit balances actually decreased somewhat over the new couple of months, followed by ups and downs that, in February 2009, resulted in a total outstanding consumer credit balance of $2,638,532,740,000 and a revolving debt amount of $998,876,180,000, or around 37.9% of the total. This month marked the first time in over a year that revolving consumer debt had dropped below $1,000,000,000,000.
Revolving debt continued to drop through the remainder of the decade, likely due to consumers’ economic uncertainty. In December of 2009, when total consumer credit debt amounted to $2,555,016,640,000, revolving debt had declined to $916,076,630,000 (or around 35.9% of total debt).
Revolving Debt as a Percentage of the Total Outstanding Consumer Credit Balance Declines Through the 2010s
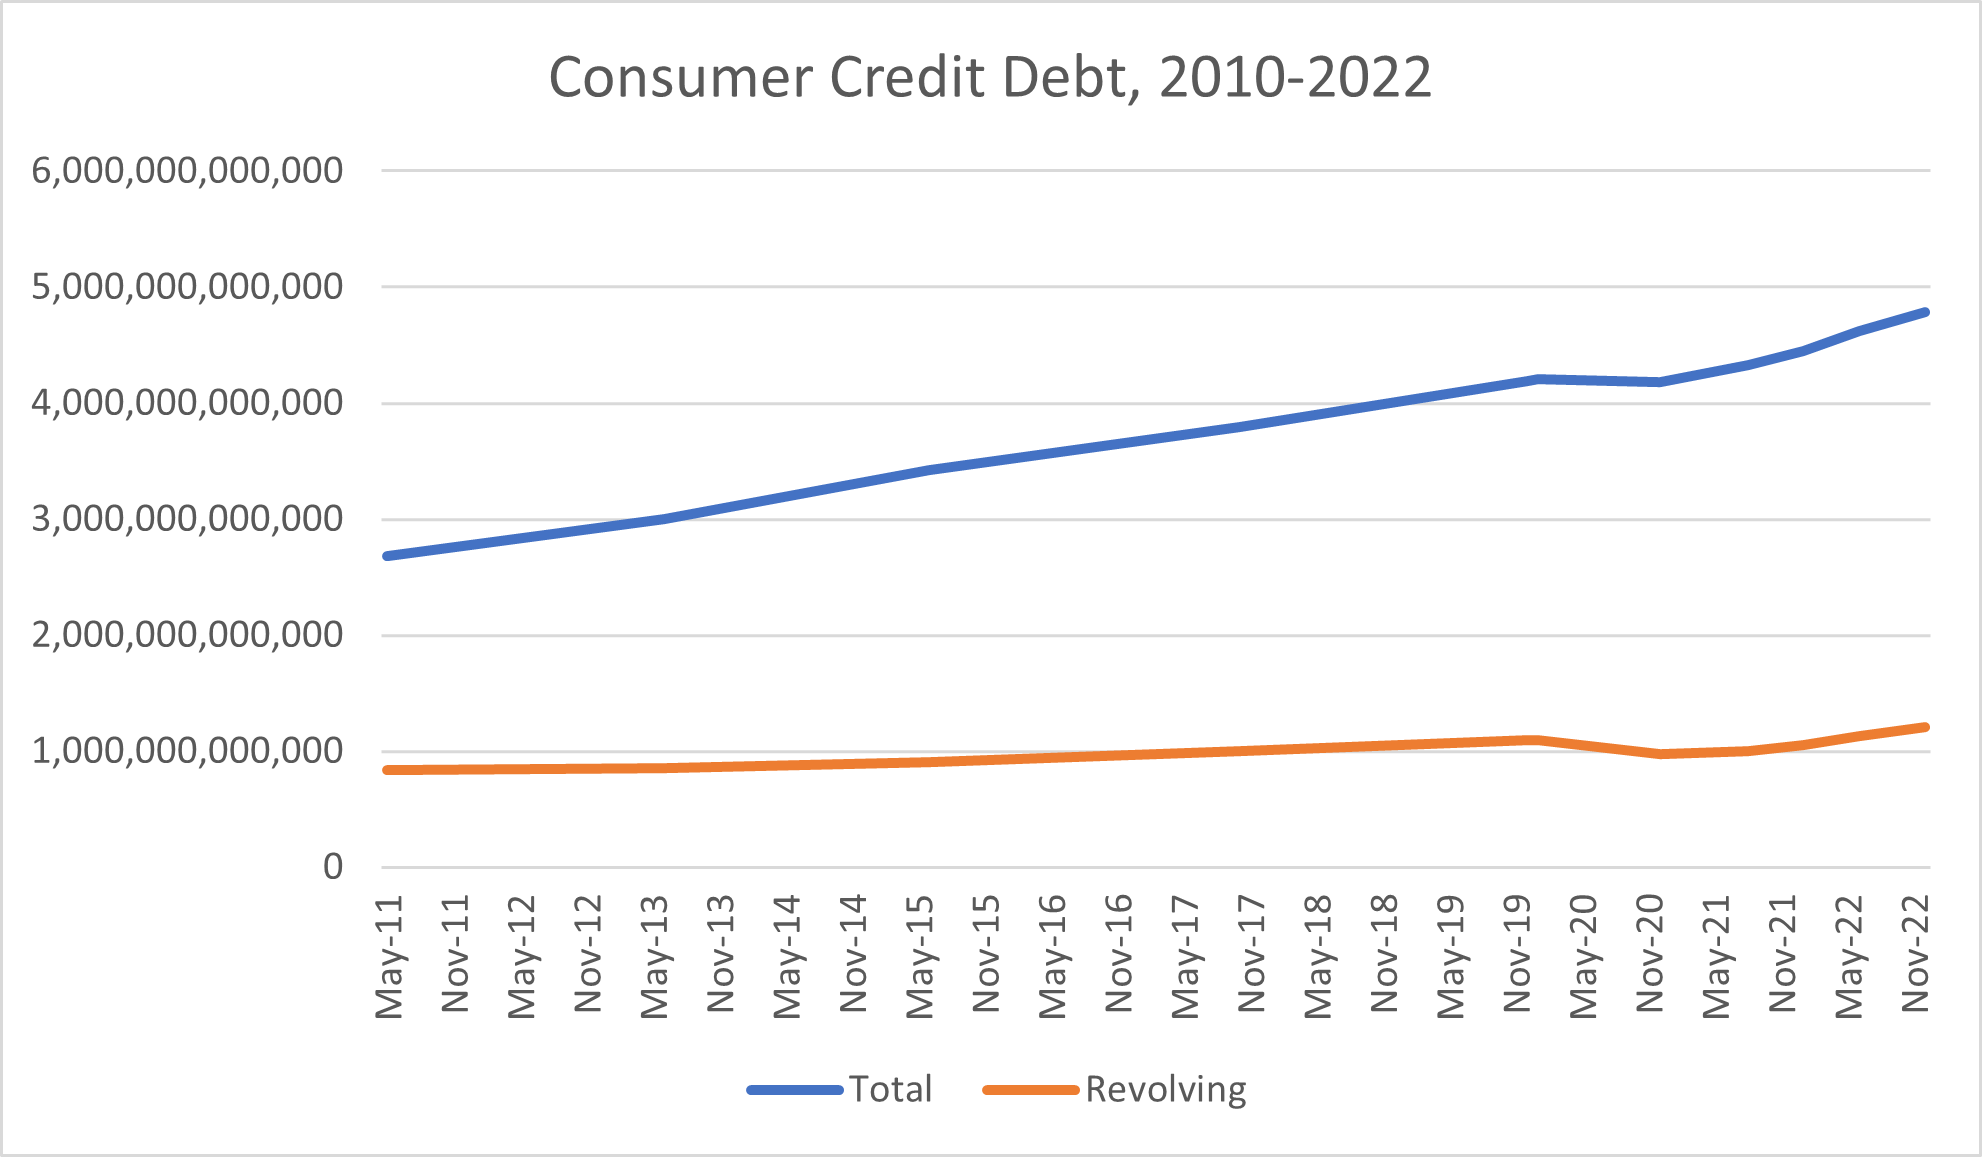
With the Great Recession officially over in June 2009, the 2010s were a decade of recovery—which could, at times, be frustratingly slow. Revolving debt continued to decline throughout the first year or so, dropping to $832,510,720,000 in May 2011, when the total consumer credit balance hit $2,683,971,000,000. By this time, revolving debt was down to 31% of total consumer credit debt.
In June 2013, when total consumer debt topped $3 trillion for the first time at $3,000,137,610,000, revolving debt accounted for $849,501,760,000, or around 28.3%. Revolving debt would eventually top $900 billion and then $1 trillion again. In June 2015, when total consumer credit debt amounted to $3,420,426,570,000, revolving debt made up $901,363,740,000, or around 26.4%. October 2017 would see consumer revolving debt top $1 trillion for the first time since January 2009, amounting to $1,004,360,870,000, or around 26.5% of the $3,794,380,740,000 total consumer credit balance. The decade ended with a total outstanding consumer credit balance of $4,192,191,400,000, and revolving balances amounted to $1,091,988,920,000 (or around 26.0% of the total debt amount).
Effects of the Pandemic and Economic Uncertainty on Consumer Credit Debt in the Early 2020s
The 2020s (so far) have also been volatile, largely as a result of the COVID-19 global pandemic, high inflation rates, and financial uncertainty in general, especially among younger Americans. Revolving balances decreased from $1,096,303,380,000 in January 2020 (when the total consumer credit debt was $4,207,686,330,000) to $974,594,430,000 (when the total debt amounted to $4,184,852,510,000) in December 2020. As a share of the total balance, the revolving balance decreased from 26.1% to 23.3% during that time.
Both the total consumer credit balance and the revolving balance rose during 2021. By August 2021, the collective revolving balance had reached $1,001,155,780,000, representing around 23.1% of the $4,331,533,990,000 total balance.
The first quarter of 2022 started with a total outstanding consumer credit balance of $4,445,518,730,000 and a revolving balance of $1,050,570,270,000 (or around 23.6%). By the middle of the year, these values rose to $4,621,922,430,000 and $1,126,420,080,000, respectively. Revolving debt made up around 24.4% of total debt. The fourth quarter of the year ended with a total consumer credit balance of $4,780,842,900,000, of which $1,203,429,310,000 (or around 25.2%) was revolving debt.
Making Meaning Out of the History of Consumer Credit Debt in America
What can we learn from looking at the history of credit card debt in America? As this credit card debt historical data illustrates, total outstanding consumer credit debt has risen sharply to 726 times what it was in January of 1943. The percentage of the total consumer credit balance for which revolving debt accounts has also increased drastically from the time when it represented a tiny fraction of all outstanding consumer credit debt.
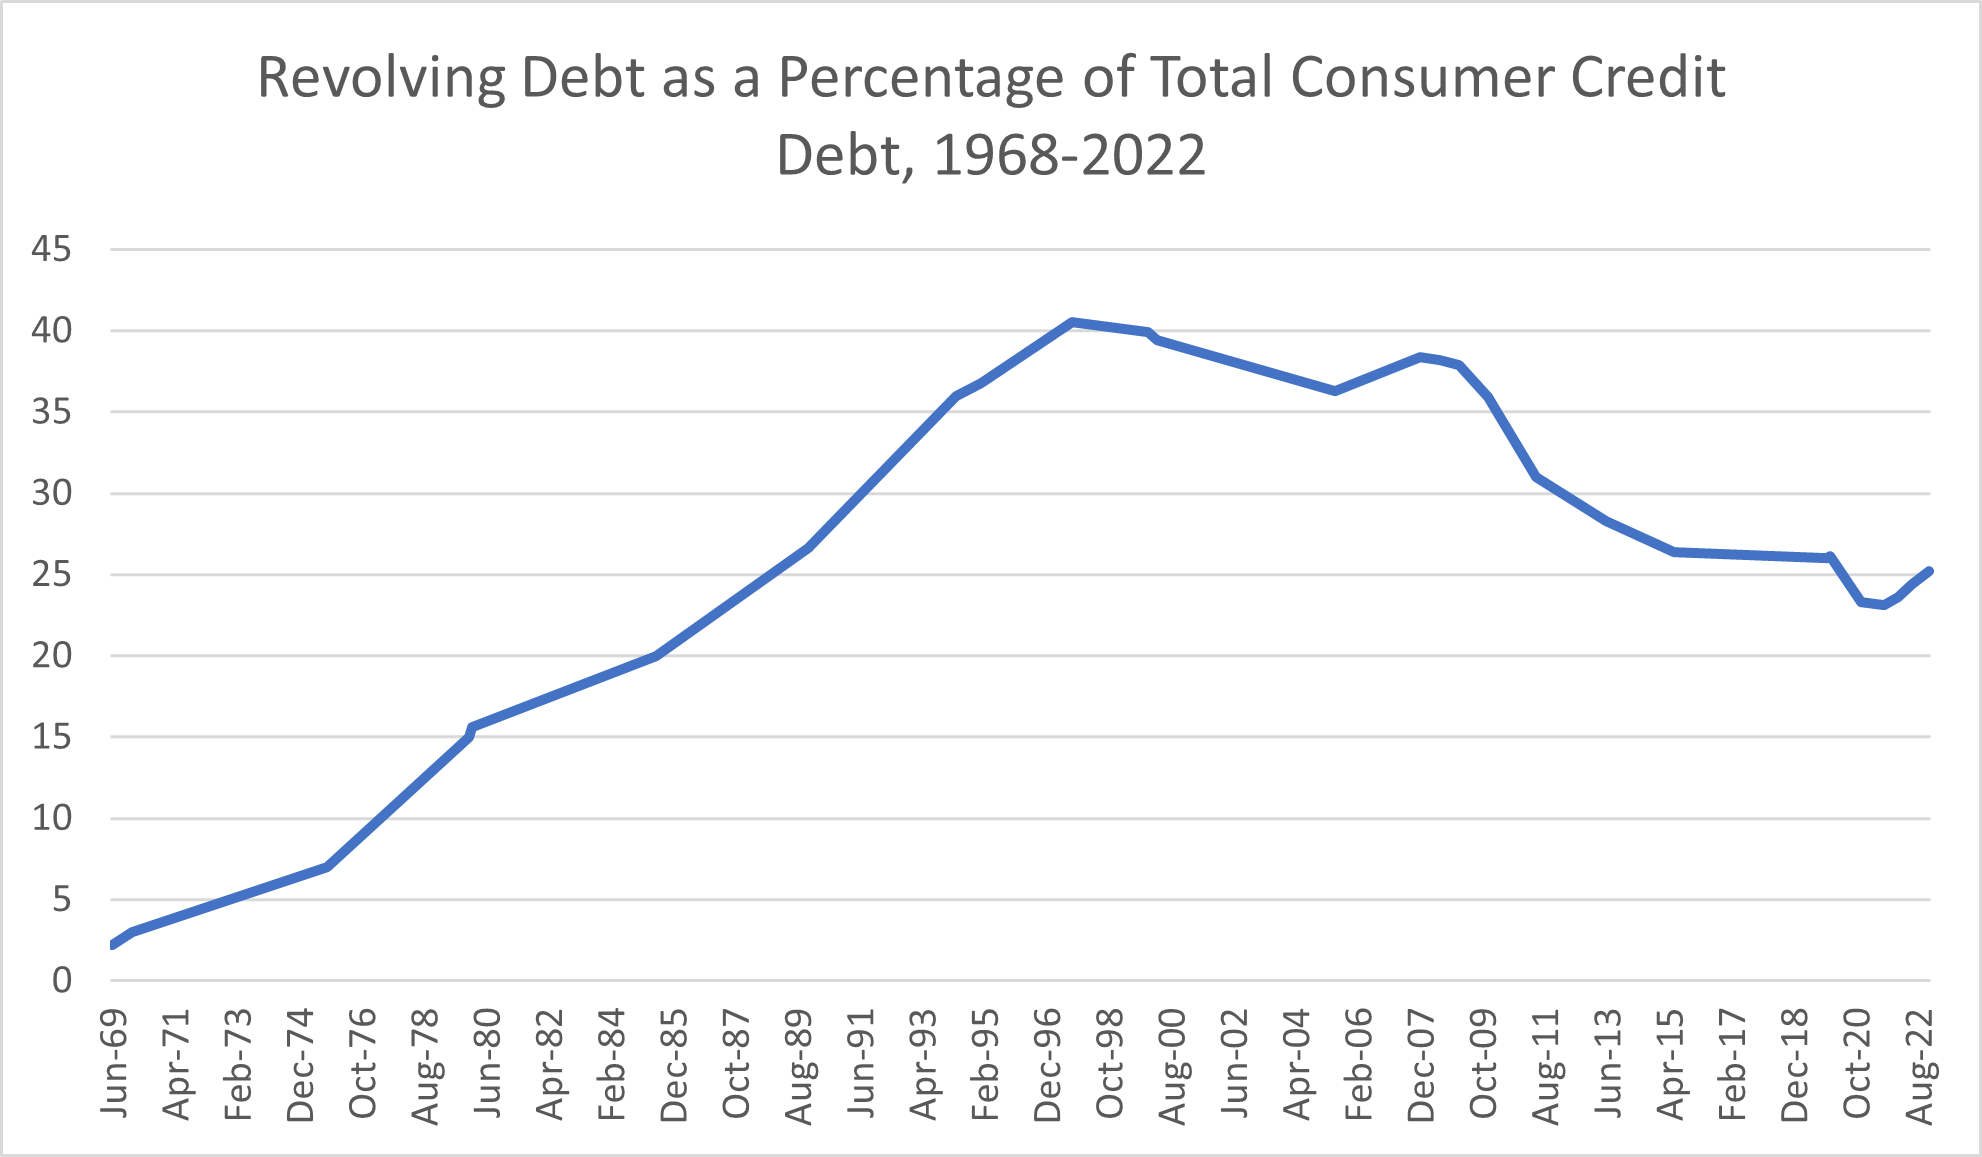
The one-quarter (more or less) of total consumer credit spending that revolving credit balances have accounted for in recent years represents an improvement from the mid- to late-’90s, when revolving balances accounted for as much as 40% of consumer credit debt. Still, as spending has returned to pre-pandemic levels, the proportion of consumer credit debt that belongs to revolving credit balances has trended upward again.
Credit Card Delinquency Rates Over Time
Another way of understanding more about the history of consumer credit card debt in America is to look at delinquency rates. Credit card accounts are considered delinquent when they are at least 30 days overdue (past their due dates), according to Experian.
The Federal Reserve Bank of St. Louis maintains quarterly records of delinquency rates on credit card loan accounts from commercial banks dating back to 1991.
Delinquency rates for the first quarter of 1991 amounted to 5.26%. After increasing to 5.48% in the second quarter, delinquency rates began to decline. By the third quarter of 1992, the delinquency rate was under 5%.
Credit card delinquency rates reached a new low—and that’s a good thing— in the third quarter of 1994, at just 3.25%. After that, more Americans seemed to struggle with paying their bills on time. The delinquency rate rose to 4.04% by the first quarter of 1996. By the fourth quarter of 1997, the delinquency rate had climbed to 4.81%.
A few years of declines allowed the first quarter of 2000 to end with a lower delinquency rate of 4.43%. Unfortunately, delinquency rates were again on the rise after that, reaching 5.00% by the third quarter of 2001. For the next few quarters, rates of borrowers who allowed their credit card loan to become delinquent hovered a little below 5%.
Another decrease in delinquency rates started in 2003. The 4.68% delinquency rate reported for the first quarter had dropped to 4.24% by the third quarter. Over the next couple of years, delinquency rates trended downward. The 3.54% rate reported for the fourth quarter of 2005 was the lowest rate of delinquency in credit card borrowing in a decade.
2006 saw delinquency rates climb from 3.86% in the first quarter to 4.13% in the second quarter. Despite small decreases throughout the remainder of that year, and with the Great Recession looming, more consumers would be delinquent in paying their credit card bills over the period of the next few years. At the end of 2007, the delinquency rate was 4.60% and still climbing. The close of 2008 saw delinquency rates reach 5.64%. Delinquency rates would peak during the second quarter of 2009 at 6.77%.
Over the next five years, delinquency rates declined consistently to a low of 2.11% in the first quarter of 2015. Even as delinquency rates trended back upward, they stayed significantly lower than they had over the past two decades, from 2.12% in the second quarter of 2015 to 2.65% in the first quarter of 2020.
Perhaps surprisingly, delinquency rates plummeted in 2020, coinciding with the COVID-19 pandemic and the economic uncertainty that accompanied it. By the third quarter of 2020, the delinquency rate was barely above 2%, and many Americans were actively paying down their debts. In the third quarter of 2021, delinquency in credit card borrowing was down to a low of 1.55%. Unfortunately, 2022 showed upward trends in credit card loan delinquency, with rates increasing from 1.65% in the first quarter to 2.25% by the fourth quarter.
Average Credit Scores by Year
An October 2022 article published in the Personal Finance section of Business Insider reported on the average credit score in America between 2010 and 2021. For the most part, average credit scores have trended upward, from 687 in 2010 to 714 in 2021. This means that, today, most Americans have what’s considered to be “good” credit scores.
Credit Card Consumer Debt Today
How many Americans have credit card debt today? All told, close to 200 million Americans have at least one credit card, according to Bankrate’s website CreditCards.com.
Average Credit Card Debt
In the United States, the average credit card debt hit $5,910 in 2022, Experian reported. When looking at households and families rather than individuals, the average balance amounted to $6,270 in December 2022, according to the job search website Zippia.
Based on the findings of a survey published by GoBankingRates in 2023, that works out to around 100 million Americans (if not more) who are carrying credit card balances of at least $1,000. A whopping 14 million Americans carry credit card debt in excess of $10,000.
After numerous interest rate hikes, the interest rates for most credit cards are now in the double digits. When you consider that the average interest rate for credit cards in February 2023 had reached an all-time high of 23.55%, according to Lending Tree, it puts in perspective just how costly credit card debt really is.
Collective Credit Card Balances
Collectively, Americans had accumulated $986 billion in credit card balances in the fourth quarter of 2022, according to a report by the Federal Reserve Bank of New York (New York Fed) Center for Microeconomic Data. This figure represents a significant increase not only from a year earlier but also from the pre-pandemic high of $927 billion.
According to the latest data published by the New York Fed, credit card debt in the prior quarter (that is, the fourth quarter of 2022) made up 5.83% of the $16.9 trillion total households debt amount.
Today, credit cards and other lines of consumer credit are everywhere. Most vendors, even small businesses, now accept some form of credit card or electronic payments. It follows naturally that, with the increase in the abundance of credit cards and opportunities to use them, credit card debt would become larger and more prevalent, as well. Looking at historical records and the latest data highlights the complexities and nuances of credit cards and credit card debt in the economy, including how American consumers use credit cards, how much debt they choose to carry, and when they prioritize paying down their credit card balances.