
Diving deep into credit card debt statistics, I’ve uncovered revealing insights on its distribution across various US demographics. Curious about how race, gender, or location might influence debt patterns? Let’s decode these numbers together and grasp the bigger picture.
A Note on the Good and Bad of Credit Card Debt and Usage
It’s worth noting that neither credit card usage nor some amount of credit card debt is, in and of itself, a bad thing.
Delinquency, certainly, can bring about some serious negative financial consequences. For consumers, paying a great deal of interest on their credit card accounts is a waste of money. Revolving balances that keep growing each month can cause debt to swell to unmanageable amounts. Too many Americans across all demographic populations are, unfortunately, facing this problem.

Yet having access to credit cards is, ultimately, a good thing. Credit cards have their uses, whether to pay emergency expenses like unexpected car repairs or medical bills that can’t wait or to take advantage of rewards that, for the consumer, can constitute “free” money. In addition to rewards and card benefits, responsibly using (and paying off) a credit card builds your credit so you can qualify for financing for larger purchases.
As I make meaning of the credit card debt data presented below, try to keep in mind that while high amounts of debt and delinquency rates are certainly problems for consumers—especially when they disproportionately affect certain demographics more than others—I’m not criticizing credit card usage or credit card debt.
What I want is to gain a better understanding of the nuances of credit card debt statistics among various demographic populations to better understand the causes, challenges, and potential solutions to the problems that do exist.
Overall Credit Card Debt in America
Before I dig into the demographics of credit card debt, let’s need to understand the big picture. How much debt do American credit cardholders carry as a whole?
Consumer Credit Card Statistics from the Federal Reserve Bank
Data from the Federal Reserve provides some authoritative and enlightening data statistics on credit card debt in America.
Through its Center for Microeconomic Data Household Debt and Credit Report for the fourth quarter of 2022, the New York Fed put the total debt for American households at $16.90 trillion, $986 billion of which was credit card debt. This means credit card balances account for 5.83% of all household debt.
To put this figure in perspective, the total credit card debt amount in America amounts to more than half of either the total auto loan balance ($1.55 trillion) or the total student loan balance ($1.60 trillion) in America. It’s also between one-twelfth and one-thirteenth of the total mortgage balance ($11.92 trillion) in the United States, according to the most recent data.
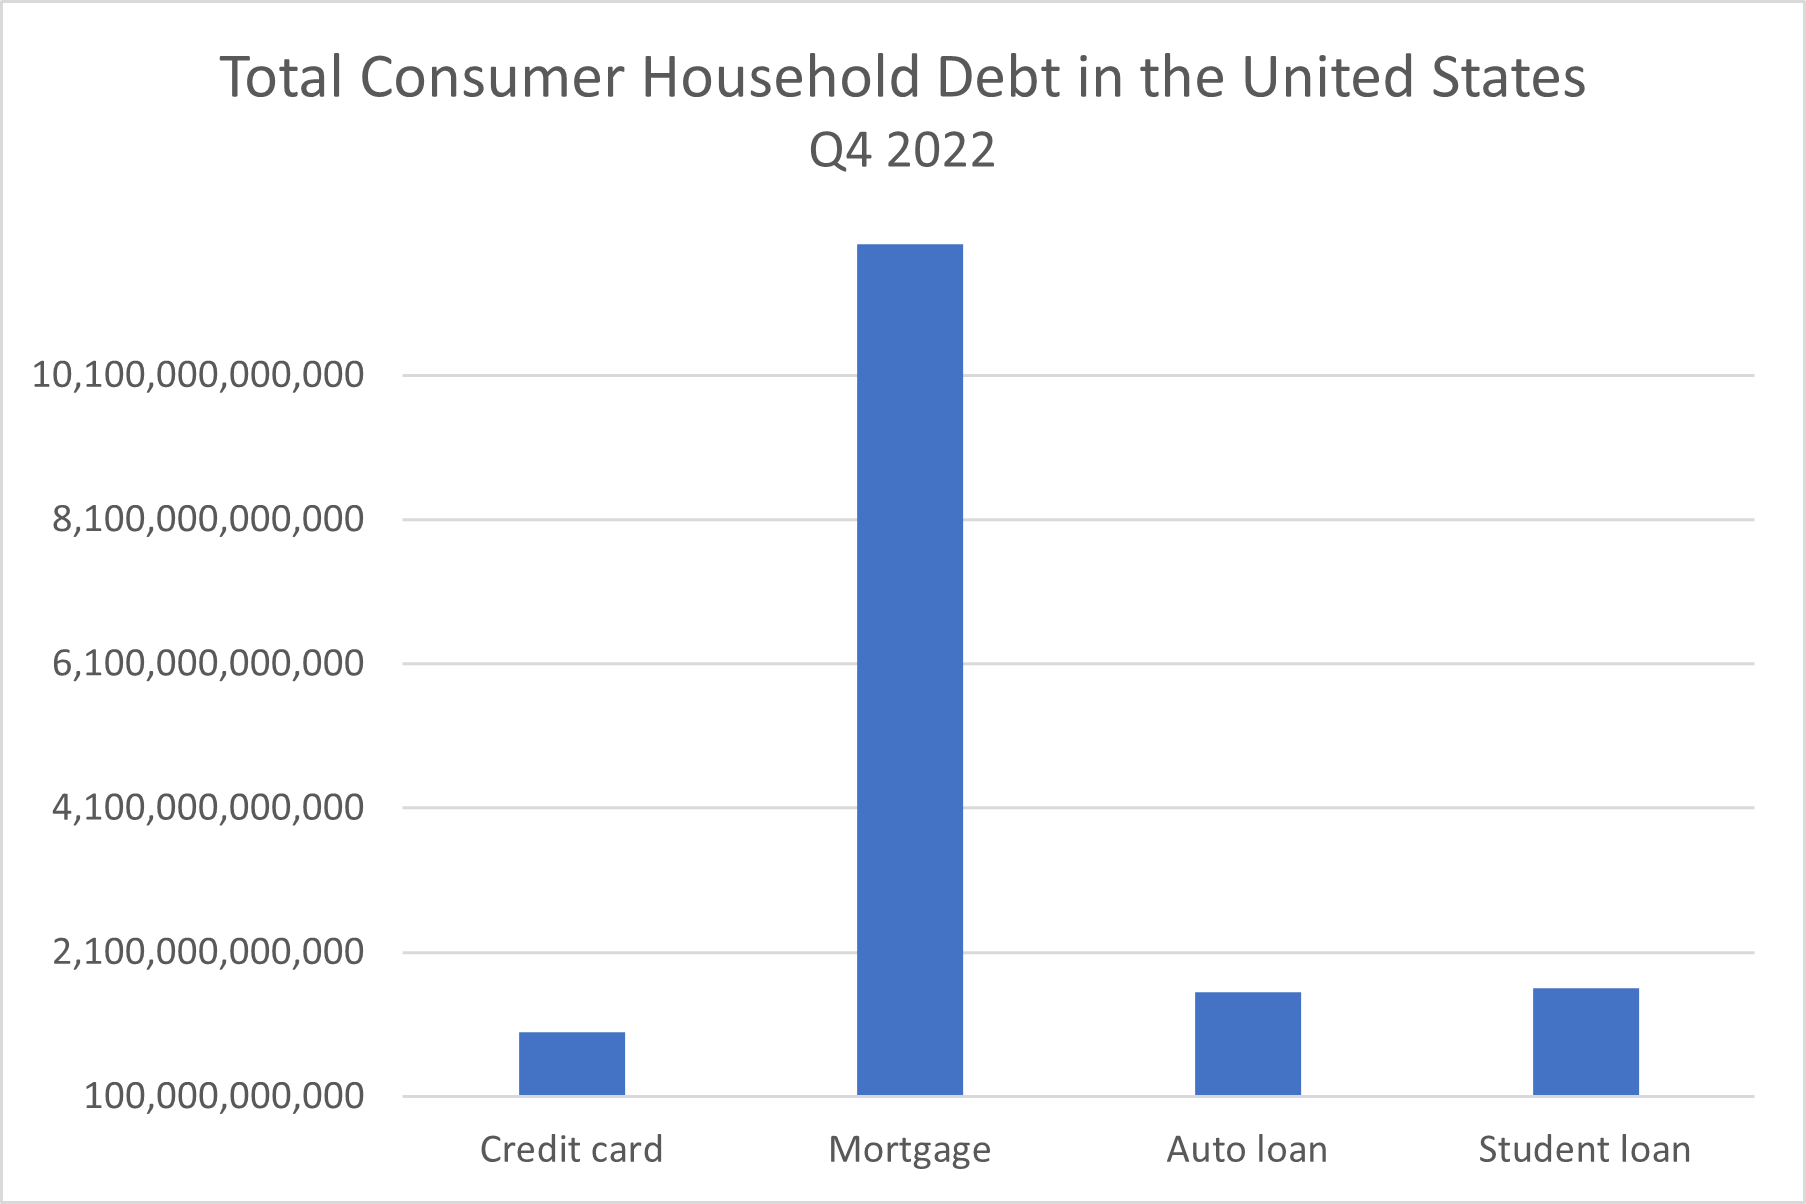
Consider how large the average mortgage balance ($236,443, according to Experian), auto loan balance ($22,612), and student loan debt amount ($39,032) are compared to the average credit card purchase (around $91 as of 2021, according to Statista).
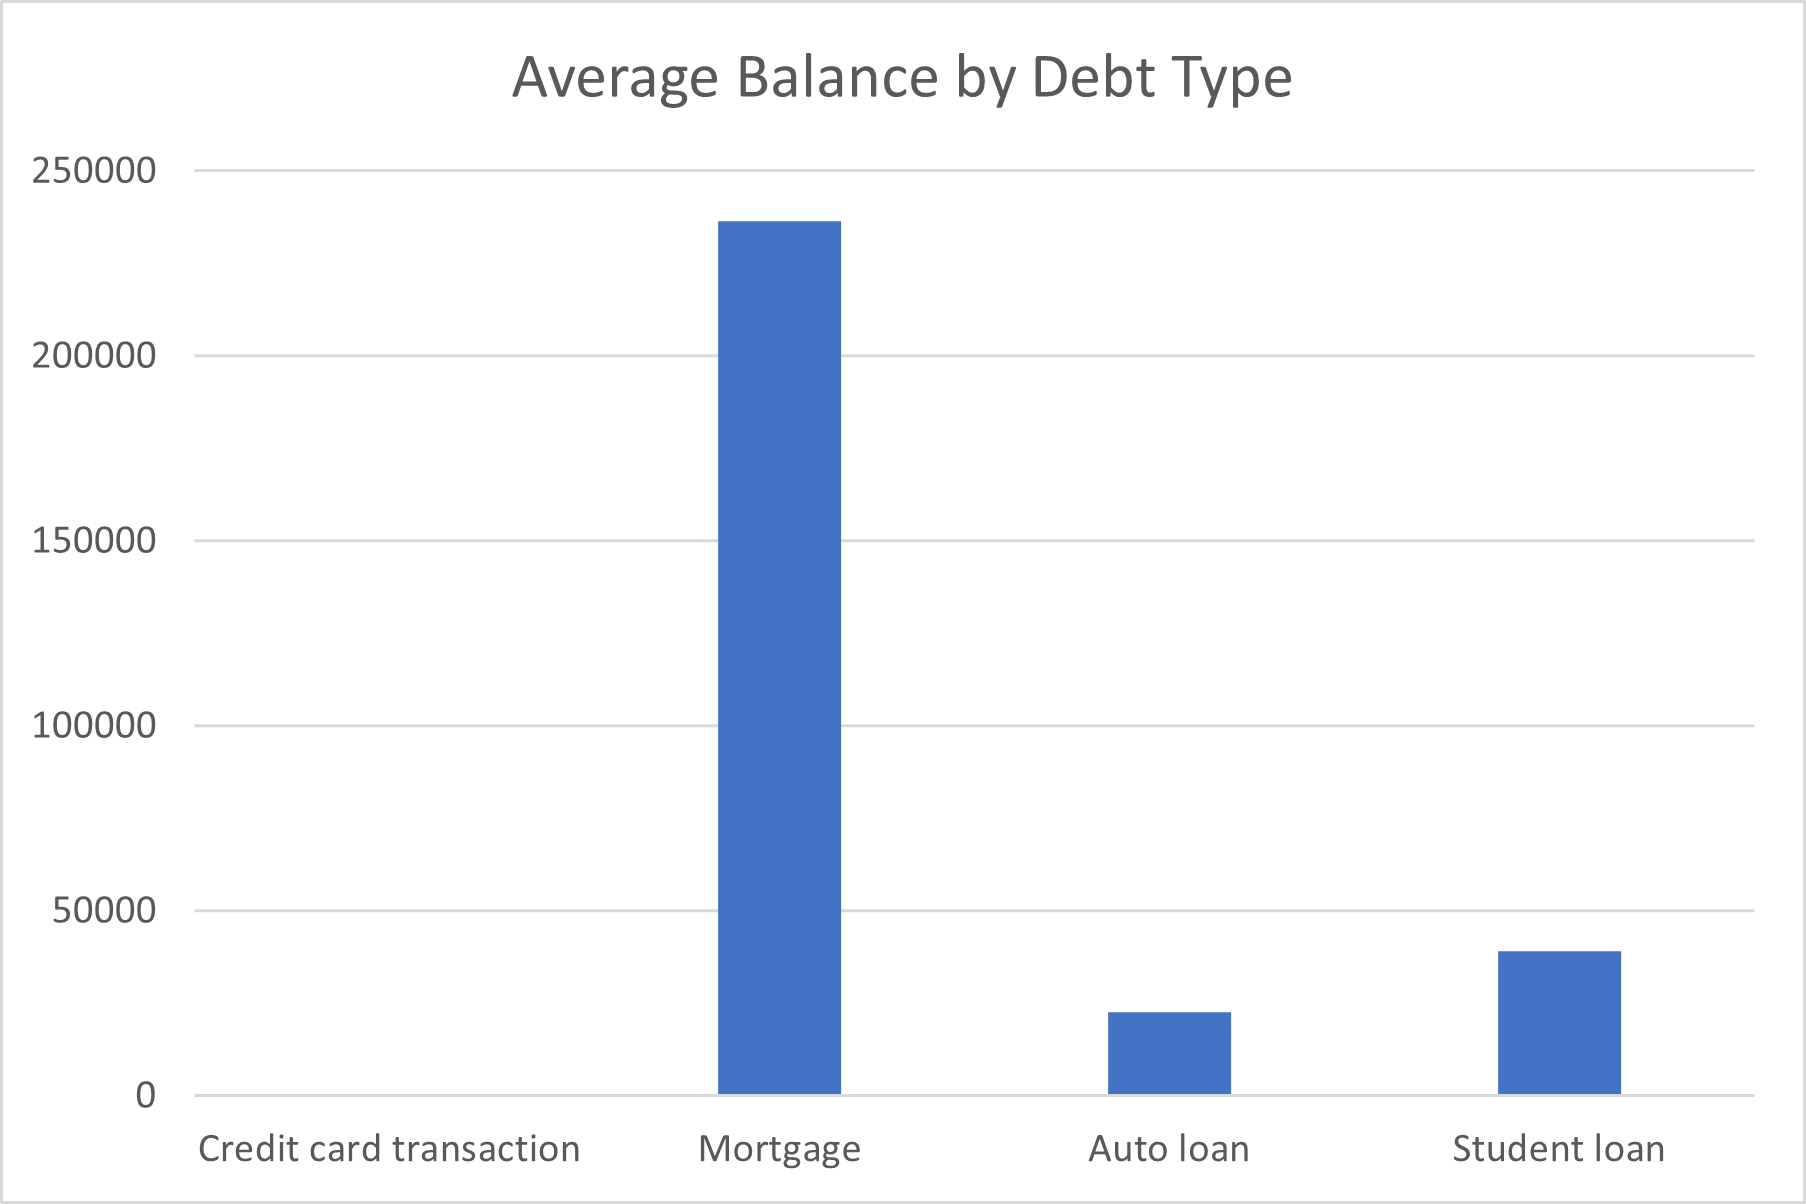
Unlike college tuition, a new or certified pre-owned car, or a house mortgage, most credit card purchases aren’t big-ticket purchases. (On the chart above, the line that represents the average credit card transaction amount fades to near-invisibility on the scale on which these other types of debt measure balances.) Yet the total credit card debt amounts to much more than its proportion of the average transaction to the average auto loan balance, student loan balance, or mortgage balance.
What’s clear from this data is that American cardholders are using their credit cards a lot. In many cases, they’re also not paying off their balances in full, which is a credit card mistake. The revolving credit card debt Americans are carrying contributes a great deal to their total debt and credit cards’ proportion of consumer debt.
The Average Amount of Credit Card Debt in America
The total amount of credit card debt in the U.S. is massive, but without context, it only tells me so much. How does that figure break down among individual American households? How much credit card debt does the average person have in the United States?
The average credit card balance among American consumers in 2022 amounted to $5,910, Bankrate reported. As I explore credit card debt across all kinds of demographics, this number can help me better understand how different segments of populations compare to American cardholders as a whole, as well as in relation to other populations.
It’s worth noting that the median debt for credit cardholders is significantly lower than the average debt amount at $2,700, job search website Zippia reported. This large discrepancy between average and median debt indicates that the consumers with the largest amounts of debt a skewing the statistics, which makes it appear that the typical American household carries more debt than it really does.
Credit Card Use and Debt by Race and Ethnicity
Credit cards are widely used by Americans of all races and ethnicities. Even among the racial group with the lowest proportion of credit usage, more than seven out of ten Americans had at least one credit card.
Still, there are noticeable differences in the proportion of cardholders in different racial and ethnic groups. The difference in credit card usage rates between the racial/ethnic group with the highest usage rate and the lowest usage rate amounted to 21 percentage points.
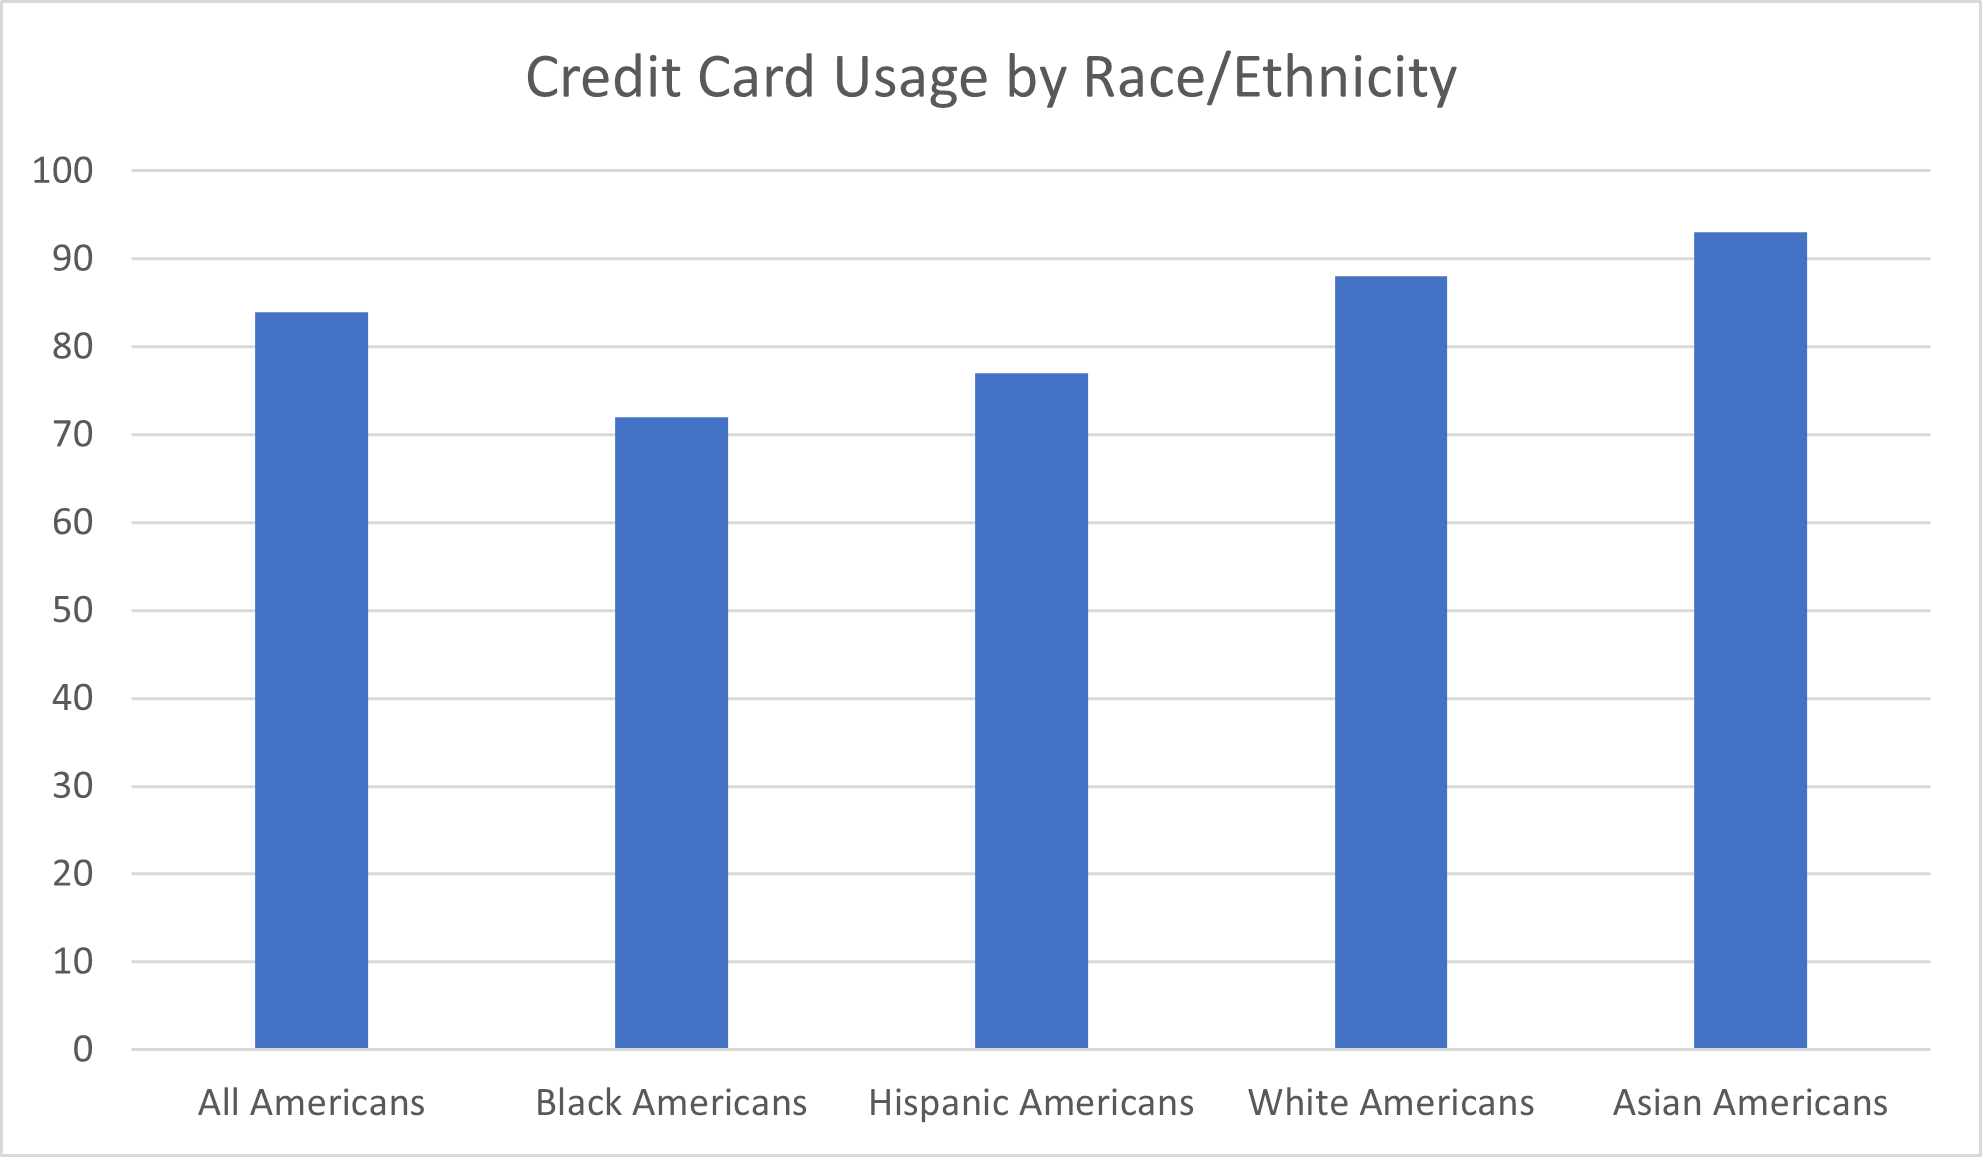
The racial/ethnic group that reported the highest credit card usage rate in 2021 was Asian, according to Forbes (based on the Federal Reserve’s Survey of Household Economics and Decision-making). A whopping 93% of Asian Americans reported using credit cards.
White Americans were the population next most likely to use credit cards, with an 88% usage rate. More than three-quarters of Hispanic Americans (77%) used credit cards. Black Americans were the racial group least likely to use credit cards, with a usage rate of 72%.
Credit Card Debt by Race and Ethnicity
The average amount of credit card debt, too, varies significantly among racial and ethnic groups, the personal finance website The Ascent (by The Motley Fool) reported.
Non-Hispanic Black Americans reported the lowest average credit card debt amount in 2020, $3,940. The average credit card debt reported for Hispanic Americans was $5,510.
Non-Hispanic white Americans reported the highest debt amount, $6,940. The data presented by The Ascent (pulled from the 2020 Federal Reserve Survey of Consumer Finances) doesn’t report a specific average credit card debt amount for Asian Americans, instead reporting for its “Other” category an average debt of $6,320.
Credit Denials by Race and Ethnicity
Discrimination based on race, color, and national origin (among other factors) by a credit card issuer is legally prohibited in the United States. This means, according to Consumer Financial Protection Bureau, that financial institutions can’t use race or ethnicity to determine whether an applicant will be approved for a line of credit, what their credit limit will be, or what interest rate to charge.
Unfortunately, the statistics show that consumers of certain racial and ethnic groups are still more likely to be denied credit or be approved for a lower amount of credit than desired compared to other populations. At all income levels, 19% of white Americans, 41% of Black Americans, 36% of Hispanic Americans, and 9% of Asian Americans were denied credit.
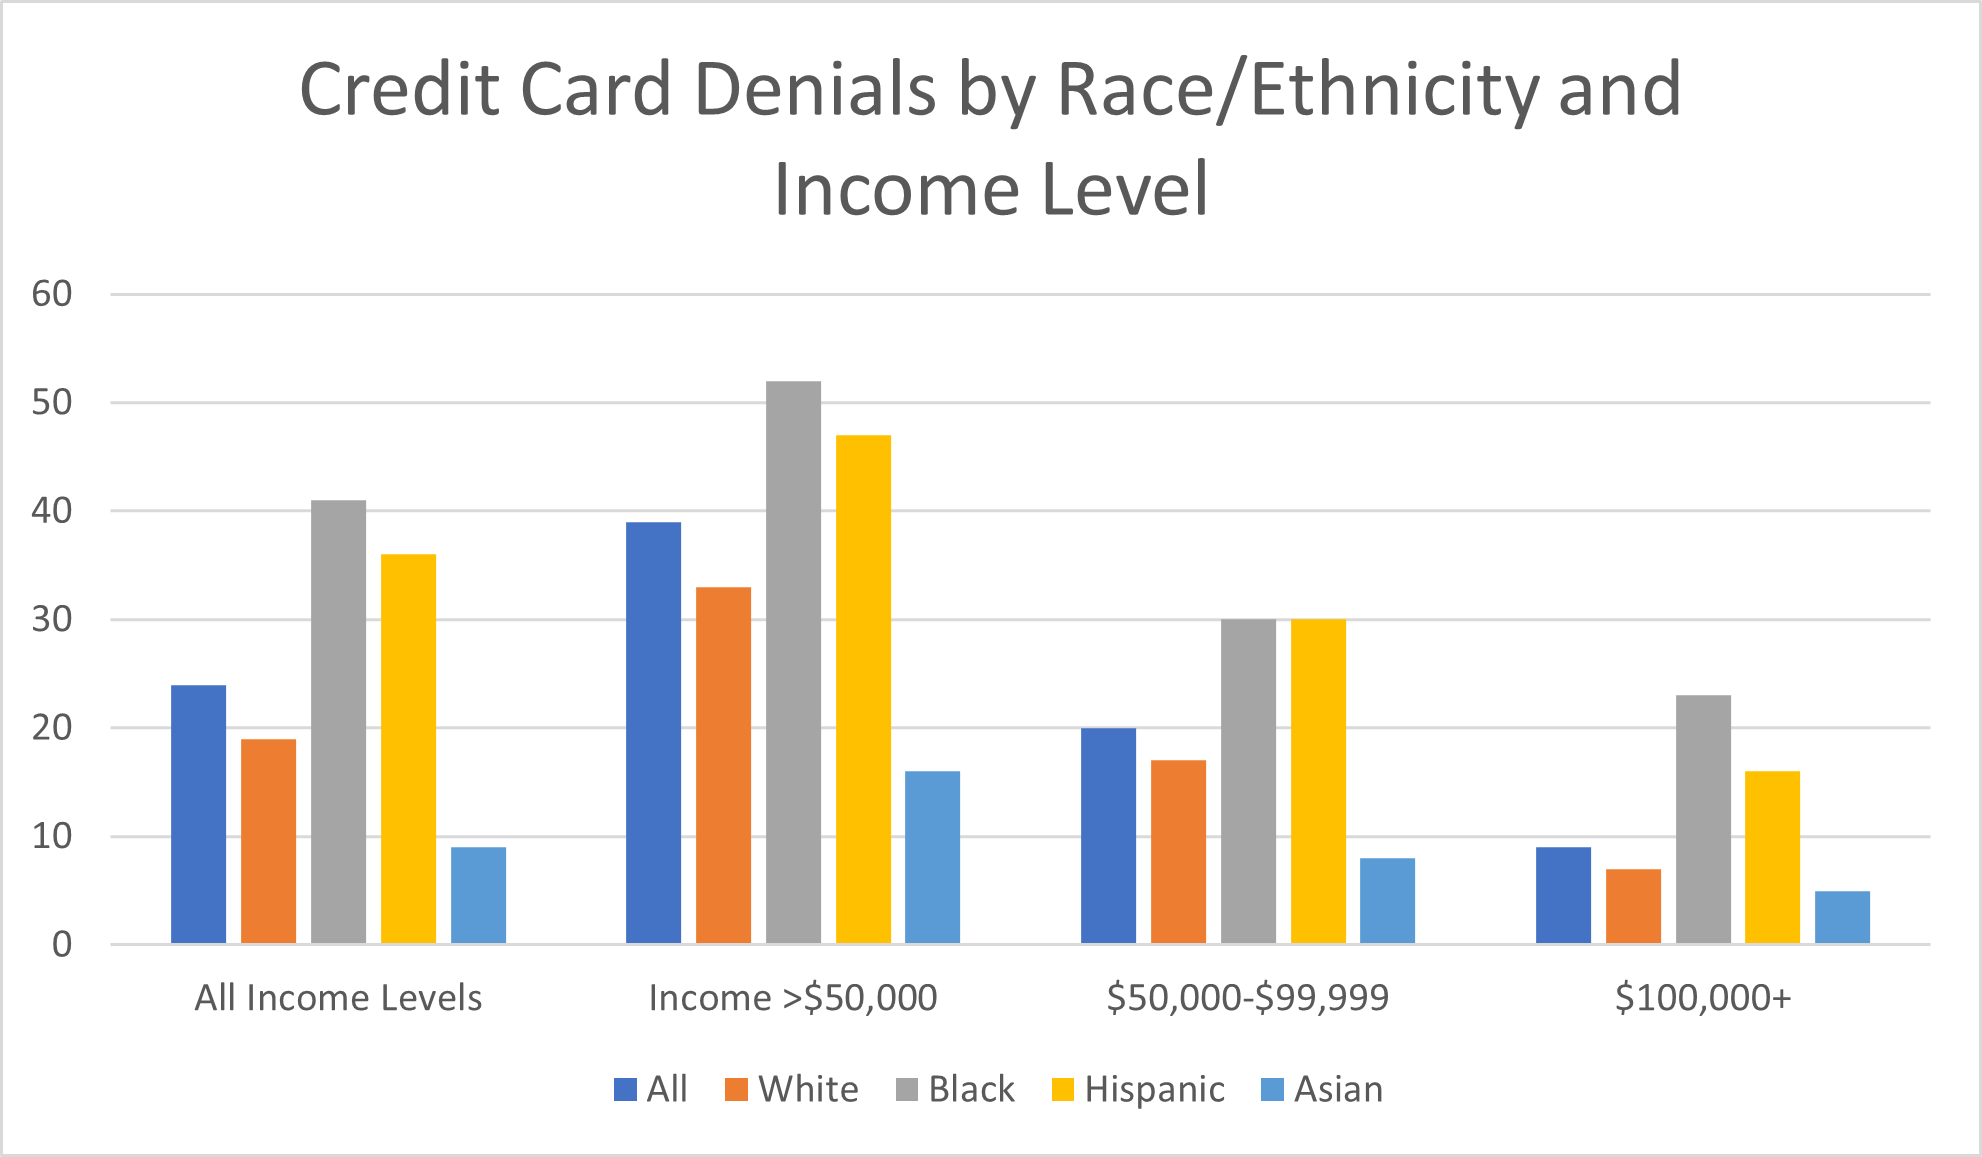
What’s more, these discrepancies can’t be blamed solely on systemic economic factors that tend to keep racial and ethnic minorities out of higher income brackets. Even compared to consumers at the same level of income, Black and Hispanic Americans were significantly more likely to be denied credit.
Among white Americans, 33% of those with an income level under $50,000 were denied credit. So were 17% of those earning $50,000 to $99,999 and 7% of those with incomes over $100,000. In contrast, 52% of Black Americans earning less than $50,000 faced credit denials, as did 30% of Black Americans in the next-highest income group and 23% of Black Americans earning more than $100,000.
Nearly half—47%—of Hispanic Americans at the lowest level of income were denied credit. The credit denial rate among Hispanic Americans at the middle and highest levels of income amounted to 30% and 16%, respectively.
The demographic least likely to be denied credit is Asian Americans. Among the lowest earners, 16% of Asian Americans were denied credit. That percentage dropped to 8% in the middle income level and 5% in the highest income range.
Credit Card Debt and Disparities by Gender
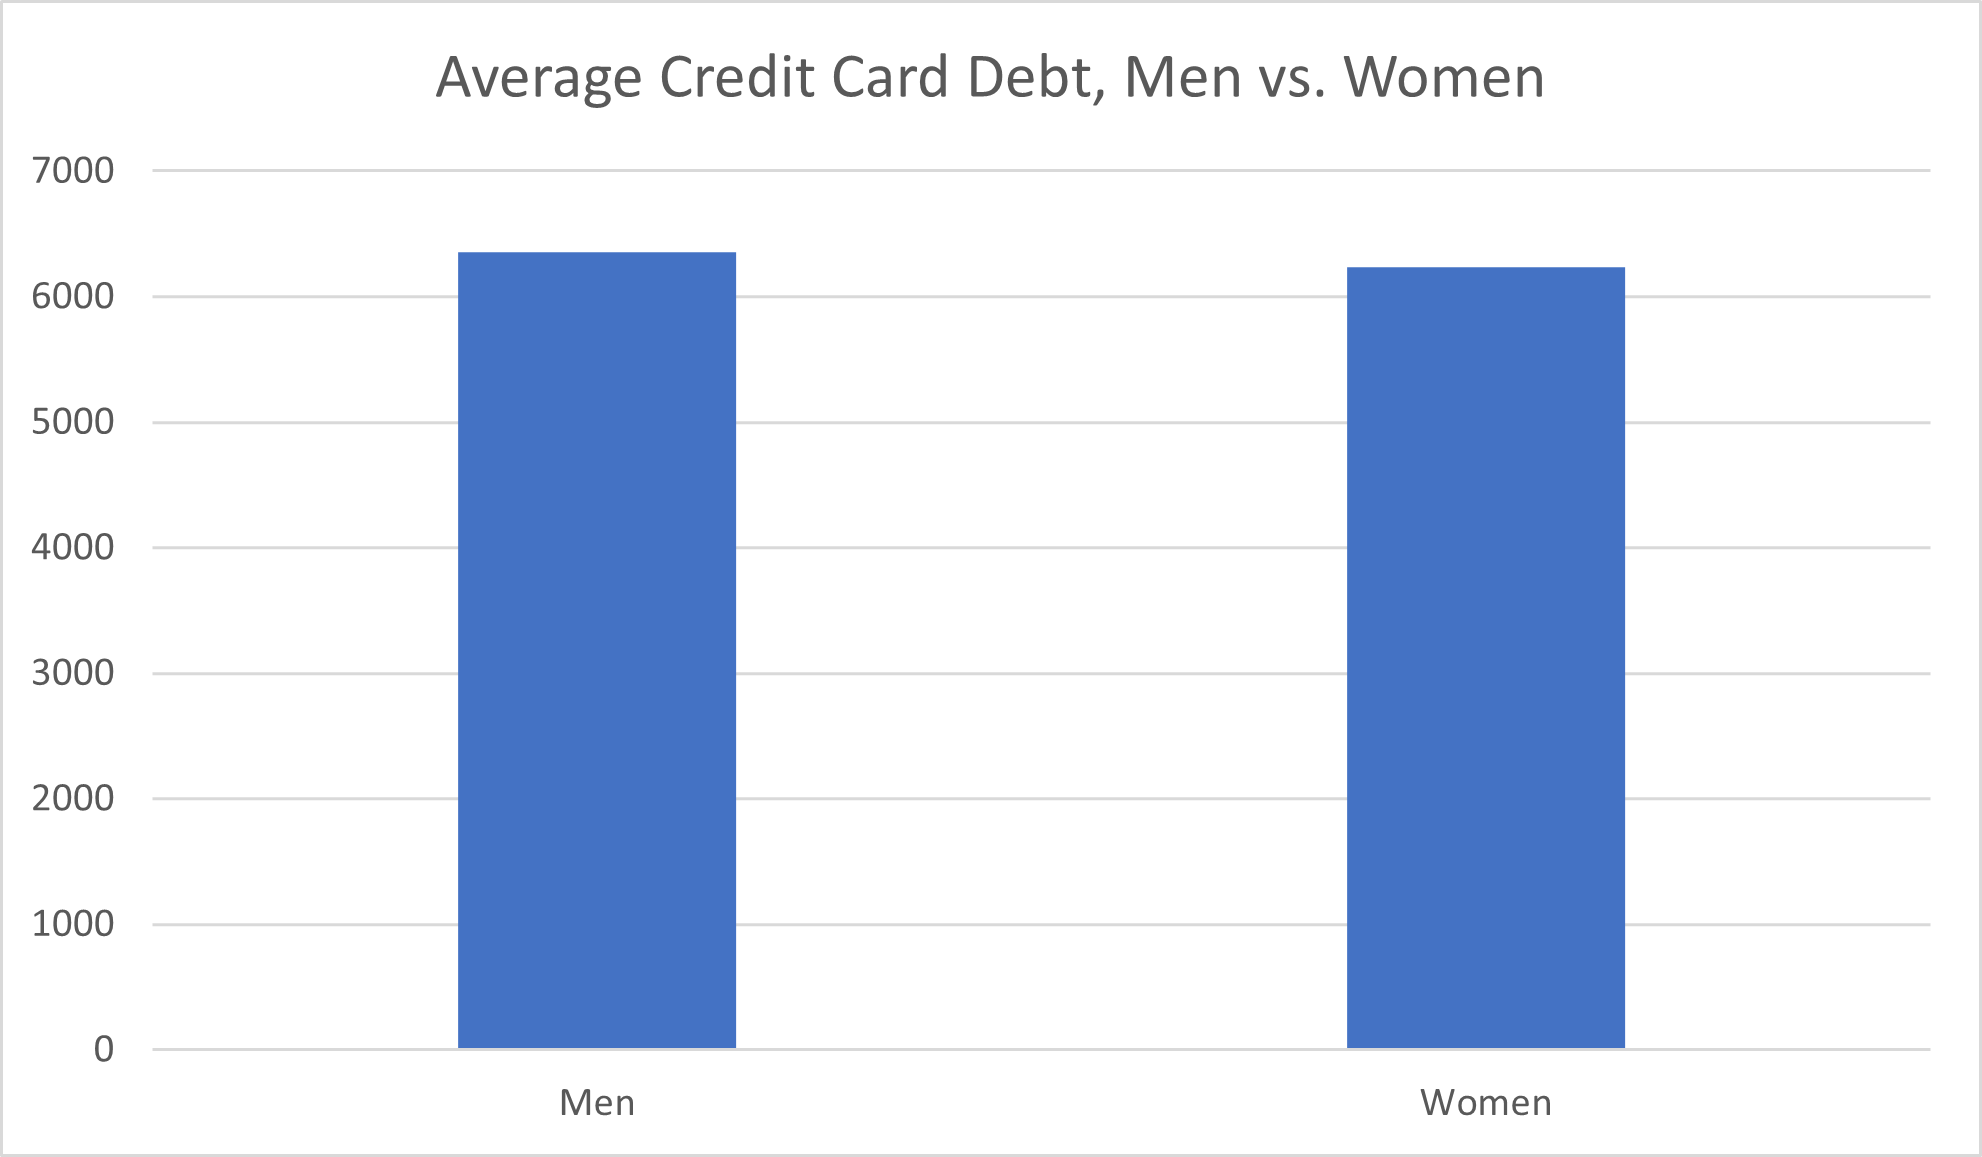
Despite stereotypes to the contrary, the difference in average credit card debt amounts between men and women is small. Experian reported an average debt amount of $6,232 for women and $6,357 for men as of the second quarter of 2019. That $125 difference amounts to 2%.
Like race and ethnicity, gender and sex (including gender identity and sexual orientation) are protected classes under which credit card issuers cannot legally discriminate. Yet gender is another example of a demographic factor that shows inequalities in the history of consumer credit in America.
Even “after controlling for credit score, income and demographic characteristics,” CNBC reported in 2021, “an ‘unexplained gender difference in bankcard limits’ of about $1,323 exists, with male borrowers having higher limits.”
Further, Forbes reported in 2021, “women are disproportionately rejected by credit cards, get lower credit limits, and receive higher interest rates” compared to men.
These discrepancies can’t be explained away by differences in credit score, which in 2019 amounted to a single point (704 compared to 705), Experian reported. Nor do they reflect differences in the existing debt women carry compared to men since, as Experian reported, “men carry more debt than women across nearly all categories.”
Women do, however, have a higher average number of credit card accounts than men: 4.5 compared to 3.6.
How Socioeconomic Class Affects Credit Card Debt
In credit card usage and debt, as in all areas of consumer finances, socioeconomic class is an important demographic factor to consider.
How much money one has plays a direct role in matters like how likely a credit card issuer is to offer a line of credit in the first place and the terms a credit card issuer will impose upon this financing.
Further, your income level may affect how and why you use credit cards. If you’re living paycheck-to-paycheck, for example, you may need to use your credit card to pay your bills and necessary expenses that you can’t afford to pay cash for between paydays.
On the other hand, American consumers who have discretionary income left after their payment for the necessities may use credit cards in different ways: to finance big purchases, splurge on wants (not needs), and earn credit card rewards.
Credit Card Debt and Usage by Income Level
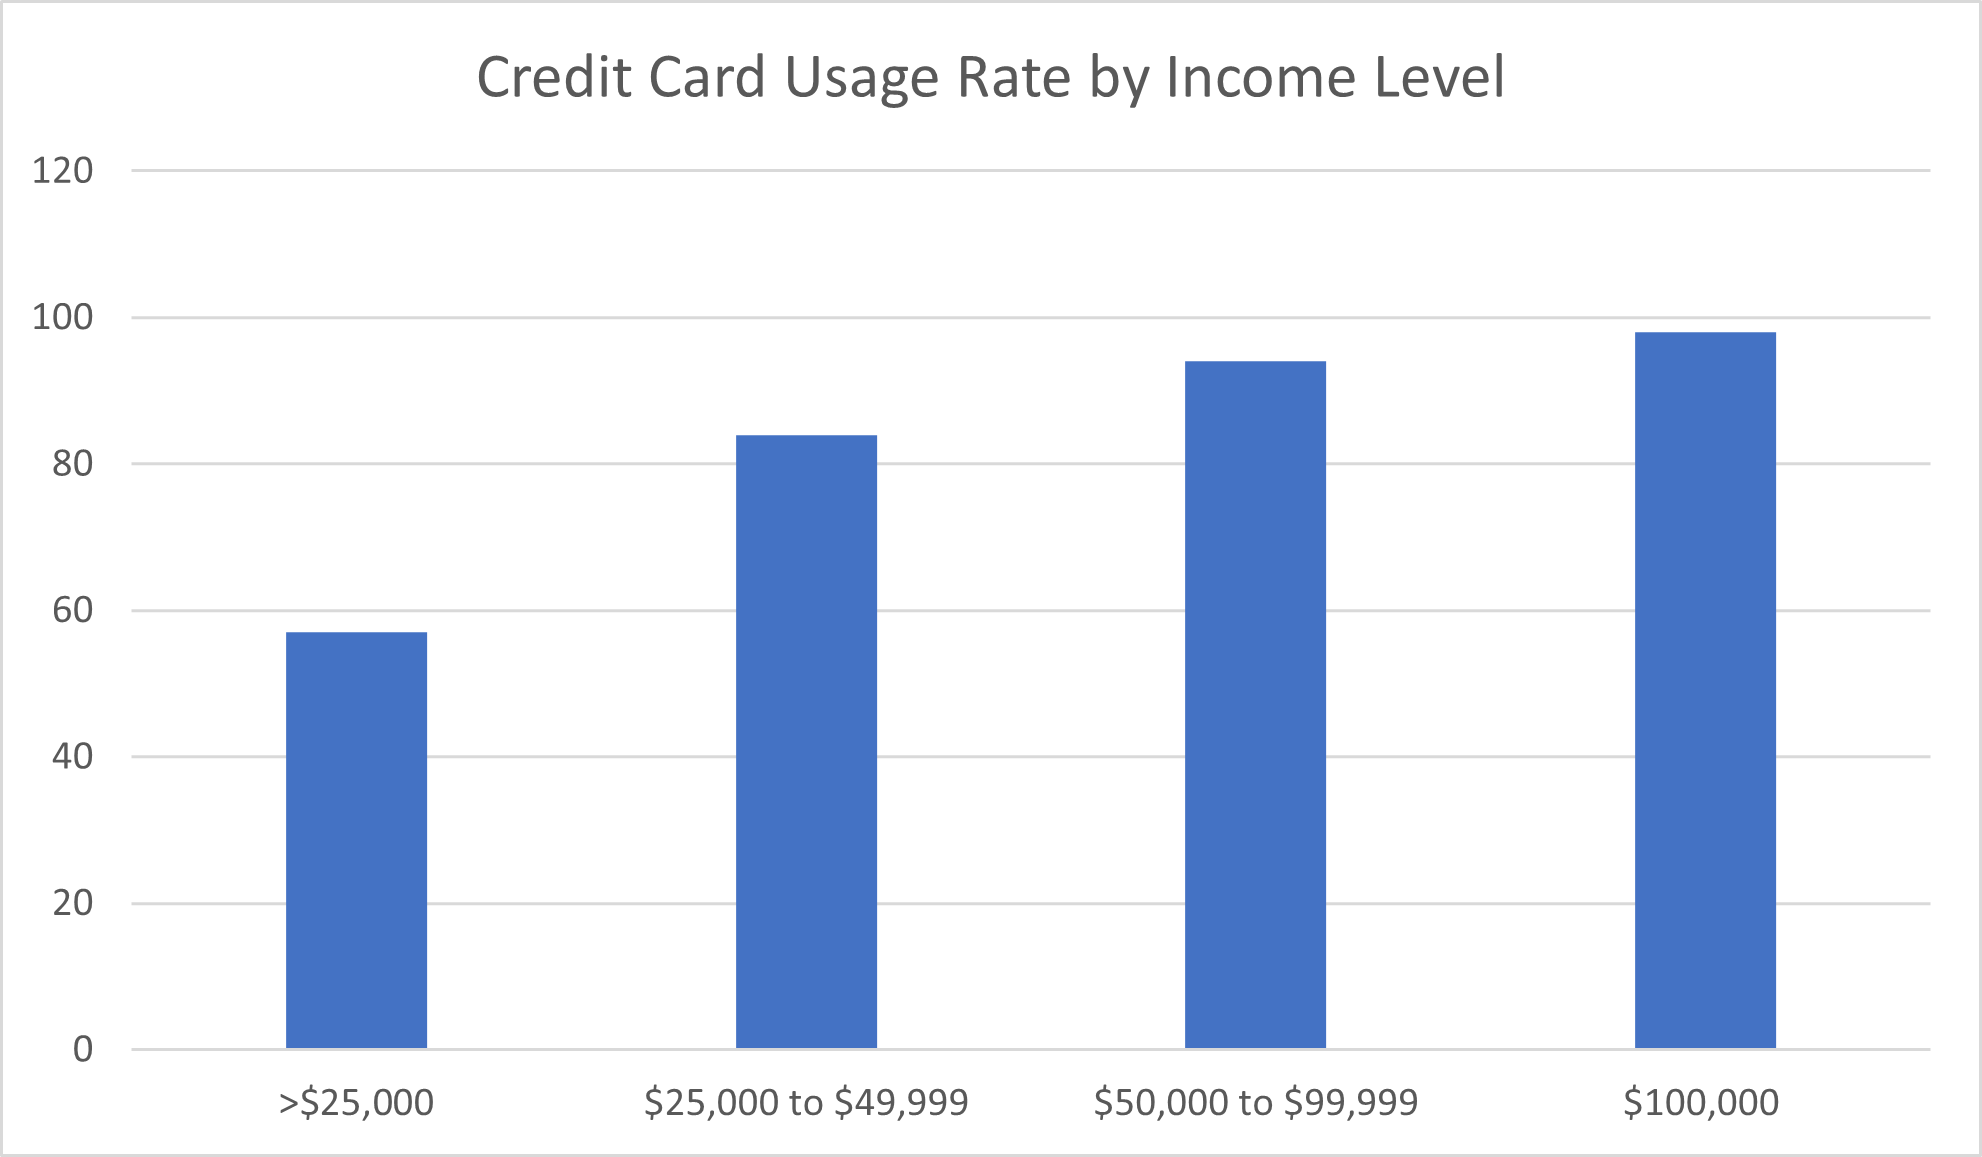
It may sound counterintuitive, but the more money a household earns, the more likely it is to use credit cards, Forbes reported.
Only 57% of households with an annual income below $25,000 reported using credit cards, compared to 98% of households earning $100,000 or more.
Credit card usage among households between these two extremes follows a similar pattern. Credit card usage among households earning $25,000 to $49,999 amounted to 84%, and usage among families making $50,000 to $99,999 per year was 94%.
Credit Card Debt by Income Level
The Federal Reserve Bank of Philadelphia provides some interesting data on credit card debt statistics by income groups.
From 2005 through 2022, more people in middle/upper-income groups consistently carried credit card debt than those in low/moderate-income groups. At its most extreme, the gap between the percentage of consumers in these groups with credit card debt exceeded ten percentage points (during the early to mid-2010s). In June 2022, 81.2% of middle/upper-class consumers had credit card debt, compared to 75.7% of low/moderate-income consumers.
The Federal Reserve Bank’s average credit card debt by income level data tells a similar story. Middle/upper-income consumers consistently have a higher average credit card debt amount than low/moderate-income consumers. In 2022, middle/upper-income consumers had an average of $5,522 in credit card balances, while low/moderate-income consumers had an average credit card debt amount of $4,458.
Yet the script flips when looking at indicators of more problematic credit card debt. Significantly more low/moderate-income consumers report using over 75% of their credit limit – way more than the recommended usage amount – than their middle/upper-income counterparts. In 2022, 19.9% of middle/upper-income consumers were using more than 75% of their credit limit, but 32.8% of low/moderate-income consumers were.
Similarly, low/moderate-income consumers are much more likely to have severely delinquent debt than middle/upper-income consumers. The most extreme gap occurred in March of 2005, when low/moderate-income consumers reported a severely delinquent debt percentage of more than twice that of middle/upper-income consumers (22.9% vs. 10.8%, respectively).
In 2022, 15.7% of low/moderate-income consumers had severely delinquent debt, compared to just 8% of middle/upper-income consumers.
Among consumers in both categories, delinquency rates have been trending downward since 2005, when they exceeded 20% for low/moderate-income Americans and 10% for middle/upper-income Americans. That’s good news, considering the havoc credit card delinquency can wreak on your credit score.
Still, the fact that low/moderate-income consumers were nearly twice as likely to be severely delinquent in their debt compared to higher-income consumers points to serious problems with regard to socioeconomic class and credit card debt.
Citation: Federal Reserve Bank of New York/Equifax Consumer Credit Panel, tabulated by the Federal Reserve Banks of Philadelphia and Minneapolis and accessed via the Consumer Credit Explorer (date accessed: 4/27/2023)

Education Level and Credit Card Usage
Income isn’t the only measure of socioeconomic class. Educational attainment is another factor that contributes to class. This factor, too, seems to affect the credit card usage and debt of American consumers.
Generally speaking, the higher level of educational attainment a person has, the more likely they are to use a credit card.
Of Americans who never completed high school, just 52% reported using credit cards, Forbes reported. Credit card usage rates rose significantly among Americans with a high school degree or GED, amounting to 76%.
Having any level of college education made consumers more likely to use a credit card. Among American consumers who reported some college or technical education or an associate degree as their highest level of educational attainment, the credit card usage rate was 83%. Americans who had a bachelor’s degree or a higher level of education reported a 96% rate of credit card usage.
Average Credit Card Debt by Educational Attainment
If more education is linked to higher rates of credit card usage, how does educational attainment fit into how likely consumers are to have debt—and how much debt they carry?
A 2020 survey by The Ascent (by The Motley Fool) found that consumers who didn’t graduate from high school have the lowest rate of credit card debt, at 35%. This makes sense, as this population is also the least likely to own a credit card.
After that, it gets a little trickier. Slightly more high school graduates have credit card debt compared to consumers with college degree holders, at 44% and 41%, respectively. These statistics indicate that it isn’t only a demographic population’s extent of access to a credit card that contributes to the likelihood of carrying debt, since degree holders are more likely to have credit cards than consumers whose highest level of educational attainment is a high school diploma.
Yet the population of American consumers that seems to be most likely to carry credit card debt is those who have completed some college but have not (or not yet) earned their college degrees.
Whether they identify as broke college students currently pursuing a degree or dropouts who likely already took on the financial burden of college costs but haven’t enjoyed the financial payoff of having a degree, the 51% of consumers who list “some college” as their highest level of education seems to have the worst of both worlds.
The likelihood of having credit card debt is only one factor to consider when exploring how education level impacts credit card debt. How much debt cardholders carry, on average, is just as important a measure of how credit card debt affects borrowers.
This data more closely resembles the data outlined above on credit card usage by education level.
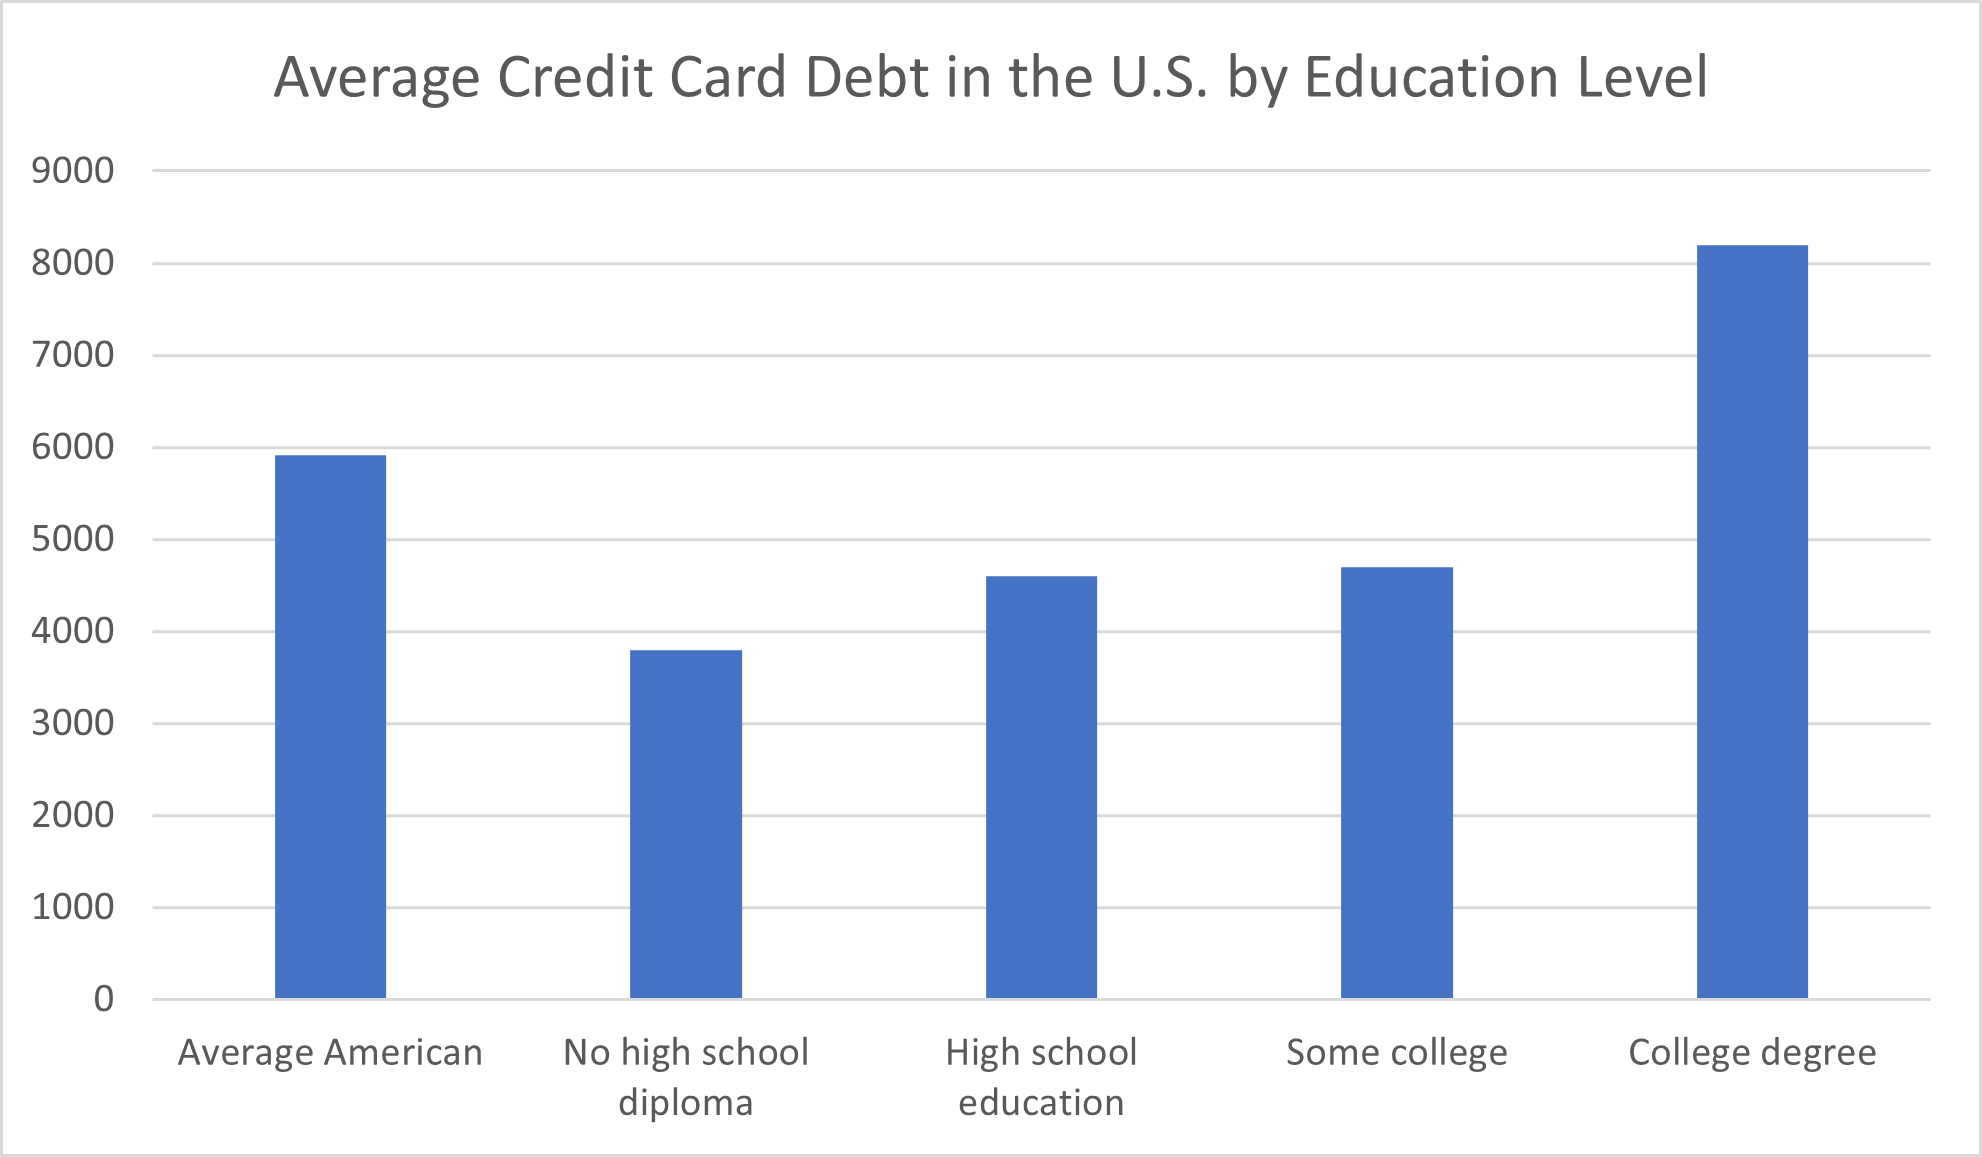
The average credit card debt amount among households without a high school diploma amounted to $3,800, The Ascent reported. High school graduates reported the next highest average balance, $4,600. A comparably small difference—just $100—separated this population’s average debt amount from the $4,700 average credit card balance consumers with “some college” education reported.
College degree holders, who were most likely to use credit cards, also reported the highest average credit card balance by a long shot. They had $8,200, or more than twice the average credit card debt Americans with no high school education reported.
Credit Card Statistics by Age and Generation
Americans generally begin their relationships with credit cards early in adulthood. By age 25, the majority of consumers in the United States—73%, according to Forbes—already have at least one credit card.
What age group has the most credit card debt? How do credit card usage and debt differ among Americans of different generations?
Credit Card Usage by Generation
Perhaps unsurprisingly, the Baby Boomer generation reported having more credit cards than any other generation, according to Forbes. Baby Boomers (aged 56-74) had an average of 4.61 credit cards.
The next younger generation, Gen X (aged 40-55), wasn’t far behind, with 4.23 credit cards. Then came the Silent Generation, representing Americans aged 75 and above, who reported an average of 3.64 credit cards.
Millennials (aged 24-39) had an average of 3.18 credit cards. The youngest generation included in the survey, Generation Z, had a significantly smaller number of credit cards, at an average of just 1.91. Considering that this age group encompasses American 18- to 23-year-olds, it makes sense that their rate of credit card ownership remains low. Many Gen Z Americans either haven’t yet gotten their first credit card or have too short a credit history to apply for a new credit card.
The Average Amount of Credit Card Debt by Age
The Federal Reserve Bank of Philadelphia’s data also breaks down credit card debt statistics by age group.
The oldest group studied (55- to 84-year-olds) consistently reported the highest percentage of consumers with credit card debt and the second-highest average debt amount. This age group, however, was significantly less likely than younger consumers to have severely delinquent debt or to use more than 75% of their credit limit.

The middle age group, consisting of 35- to 54-year-olds, consistently has nearly as high rates of reporting credit card debt (80.7% as of 2022) as their older counterparts. This age group reported the highest level of average credit card debt, amounting to $6,547 in 2022. Nearly twice as many people in this age group were using over 75% of their credit limit compared to the oldest age group.
Although a lower percentage of 35- to 54-year-olds have historically reported severely delinquent debt compared to the youngest age group, these numbers have flip-flopped since 2020. In June 2022, 11.9% of 35- to 54-year-olds reported having severely delinquent debt, just inching out the 11.4% of 18- to 34-year-olds who met these criteria.
The 18-to-34 age group wasn’t just over-represented among American consumers with severely delinquent credit card debt. Young consumers were also the ones most likely to be using more than 75% of their credit limit. Although the 32.1% of 18- to 34-year-olds who were using this high proportion of their credit limit in 2022 shows an improvement from 2005, when 41% of this age group did so, it’s still significantly higher than other age groups.
On the bright side, though, a lower percentage of this young population had credit card balances at all, and this age group reported the lowest average credit card debt amount ($3,350 in 2022).
Citation: Federal Reserve Bank of New York/Equifax Consumer Credit Panel, tabulated by the Federal Reserve Banks of Philadelphia and Minneapolis and accessed via the Consumer Credit Explorer (date accessed: 4/27/2023)
Average Credit Card Balances by Generation
Generation X led the pack on average credit card debt in 2021, Bankrate reported. This age group (defined as 41- through 56-year-olds) reported an average debt amount of $7,070.
Next-highest was the credit card debt racked up by Baby Boomers (aged 57-75), which amounted to $5,804. Millennials (aged 25-40) had more debt—$4,576—than the Silent Generation (aged 76 and above), which reported an average credit card debt amount of $3,177.
Generation Z (defined as 18- to 24-year-olds) reported an average credit card debt amount of $2,282. Again, it’s likely that this generation’s credit card debt amount is lower due to having less access to credit than consumers in other generations, who have more credit card accounts, a longer credit history, and (generally) a higher total credit limit.
Average Credit Card Debt by State
The credit card demographic data I explored so far have all reflected nationwide patterns, but what about variances across states?
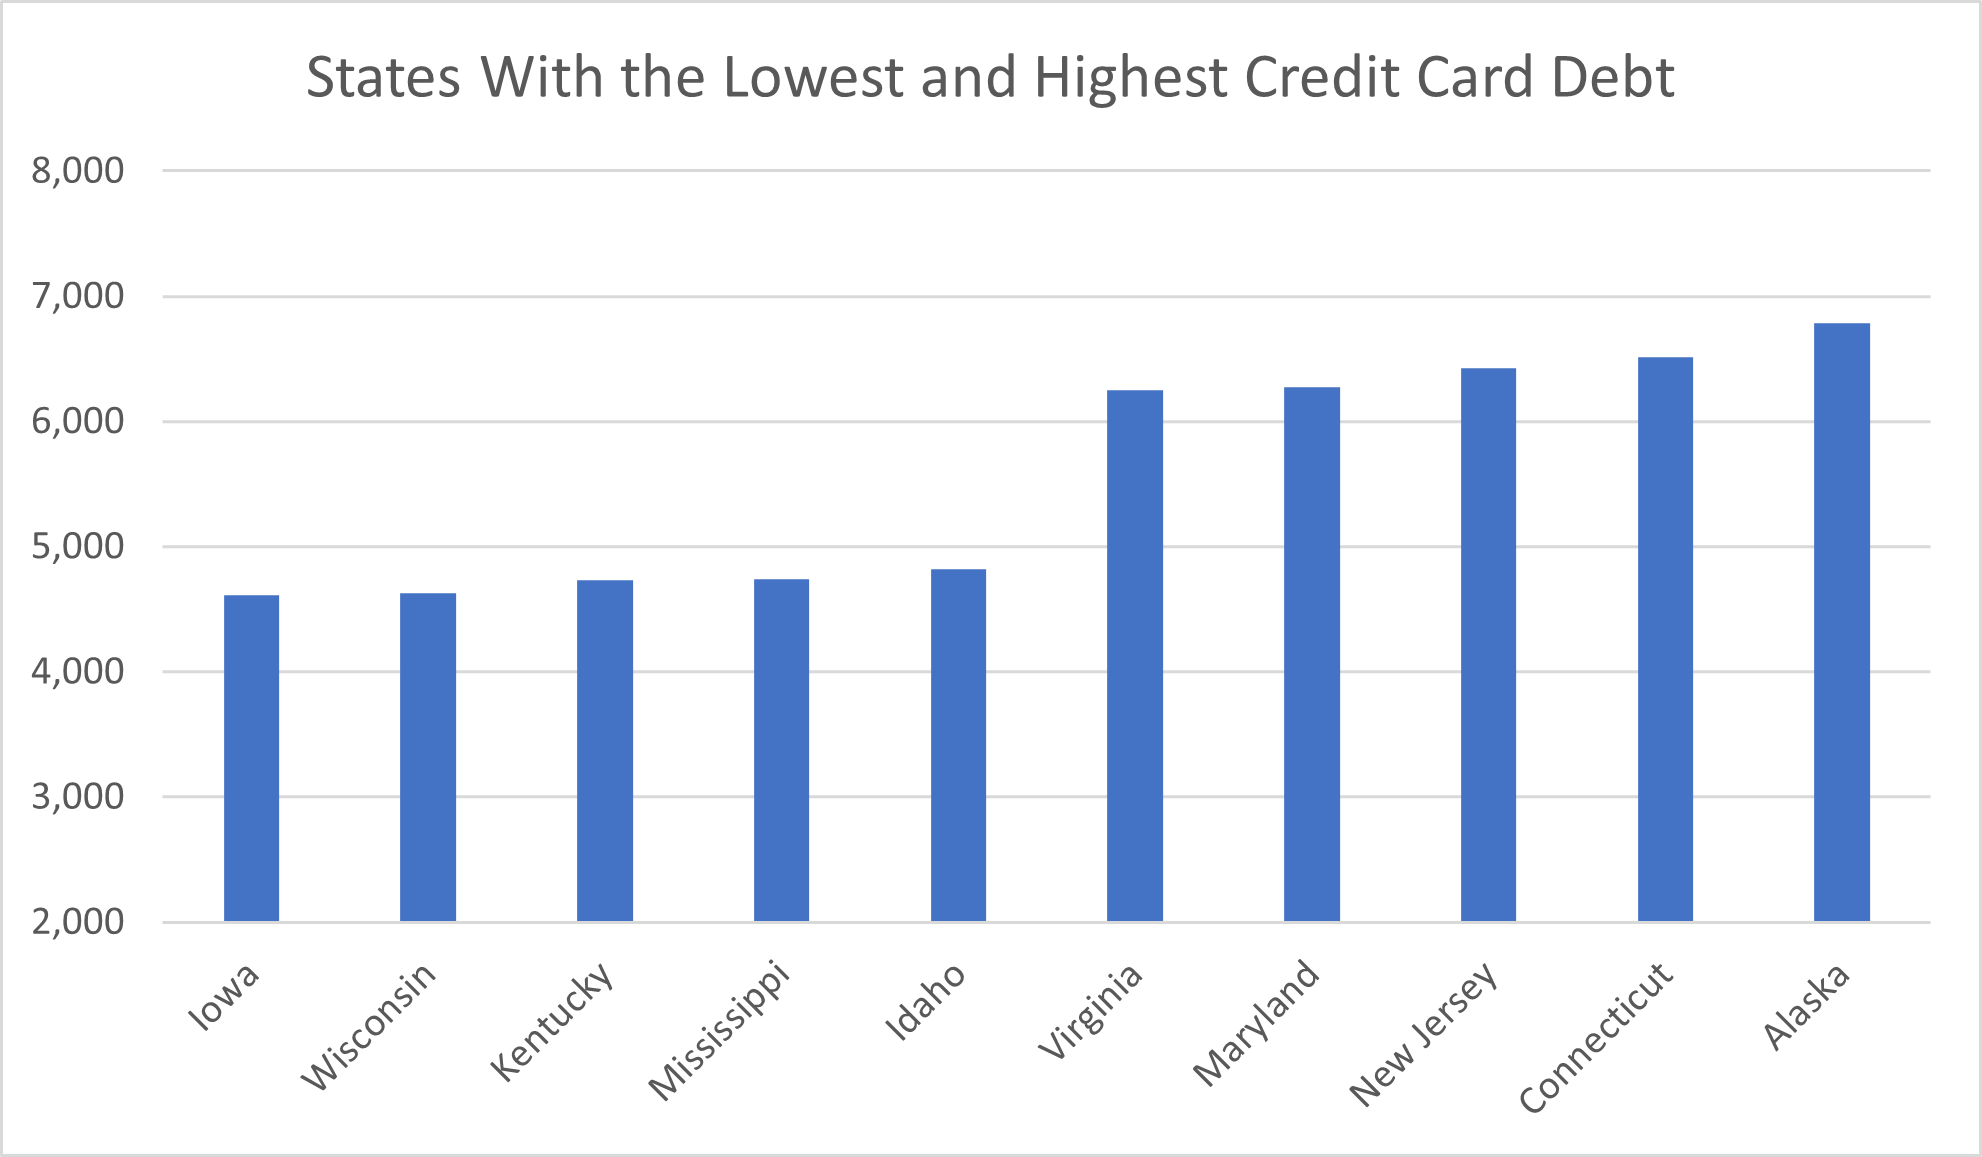
The difference between the average credit card debt in the state with the most debt compared to the state with the least debt amounted to $2,178. That’s a difference of more than 45%, Experian reported in 2022.
Alaska claimed the title of the state with the highest average credit card debt, at $6,787. Next came Connecticut, at $6,516, closely followed by New Jersey, at $6,428. Maryland and Virginia rounded out the top five, with average credit card debt amounts of $6,276 and $6,249, respectively.
The state with the lowest average credit card debt amount was Iowa, where residents owed a mean figure of $4,609. Wisconsin wasn’t far ahead, reporting an average credit card debt amount of $4,628. The next lowest were Kentucky and Mississippi, with $4,734 and $4,741 average debt amounts, respectively. In Idaho, the average amount of credit card debt was $4,821.
Conclusion
Numerous factors are likely to contribute to the statistical differences in credit card usage and debt across demographic populations. Some may be systemic, while others are based on financial choices and financial literacy—matters that information and education for all demographic groups in the U.S. can help improve.
Looking at credit card debt differences among income levels, for example, a person with a lower income level won’t qualify for as high a credit limit as cardholders who earn more money. This effectively limits the amount of credit card debt they can dig themselves into.
Further, as consumers move into higher levels of earnings over time, they may start to experience the phenomenon of “lifestyle creep,” in which purchases that were once considered luxuries and splurges become increasingly viewed as habitual purchases or even necessities.
As the data shows, having more money doesn’t necessarily translate to having the least debt. If you choose to make only the minimum payments on credit cards with high-interest rates even though you could afford to pay the bill in full, you will be paying off your remaining balance for a long time—and paying much more than the original transaction cost.
On the other hand, a financially savvy cardholder who earns less money may be able to reduce credit card debt faster by consistently lowering balances through a well-thought-out repayment plan.
Alternatively, it’s possible that higher earners are, rightly or wrongly, simply more comfortable taking on more debt than earners at lower income levels, who know they can’t afford to pay off high balances at a high interest rate. Whatever the case, the data shows that simply having a higher level of income doesn’t automatically diminish credit card debt.
Similar arguments could be made pertaining to other demographic data, like age and education level.
Demographic differences in credit card debt pertaining to race, gender, and state may also be highly nuanced, especially given the legal prohibitions that exist on outright discrimination based on factors like race and sex.
While these demographic factors can’t be directly considered in applications for credit cards, economic factors that currently (and have historically) affected factors like income levels and socioeconomic class for specific groups may contribute to rates of credit card usage, credit card application denials, credit card debt amounts and credit card delinquency rates.
The raw data on the demographics of credit card debt and usage may not offer up a lot of direct, definitive answers. Numerous complex and confounding variables make it difficult to draw direct conclusions around simple, singular causes for why these patterns exist.
Still, there’s a lot I can learn about consumer finance, financial literacy, and economic inequality from exploring credit card demographics. At the very least, this data gives me plenty to think about.