After a long and dreary winter, baseball season is finally underway—just in time for the news that inflation has hit a 40-year high.
The salaries of our favorite baseball players are subject to their own sort of inflation. This particular inflation rate towers over the Consumer Price Index (CPI) typically used to quantify inflation.
[To learn more, jump to our article about how inflation is impacting everyday consumers.]
Since 1960, the Consumer Price Index has seen an 8-fold increase. The salaries paid to top performers in professional baseball have seen a mind-blowing 500-fold increase. Now that’s what we call a home run!
Baseball salaries, especially for top performers, have skyrocketed at a dizzying speed over the last several decades. Let’s look closer at the rise of baseball salaries and how star players’ earnings have kept pace with—or, more accurately, left in the dust—increases in average earnings, the costs of necessities and luxuries, and other measures of inflation.
[Get a deeper look at salary inflation across all professional sports.]
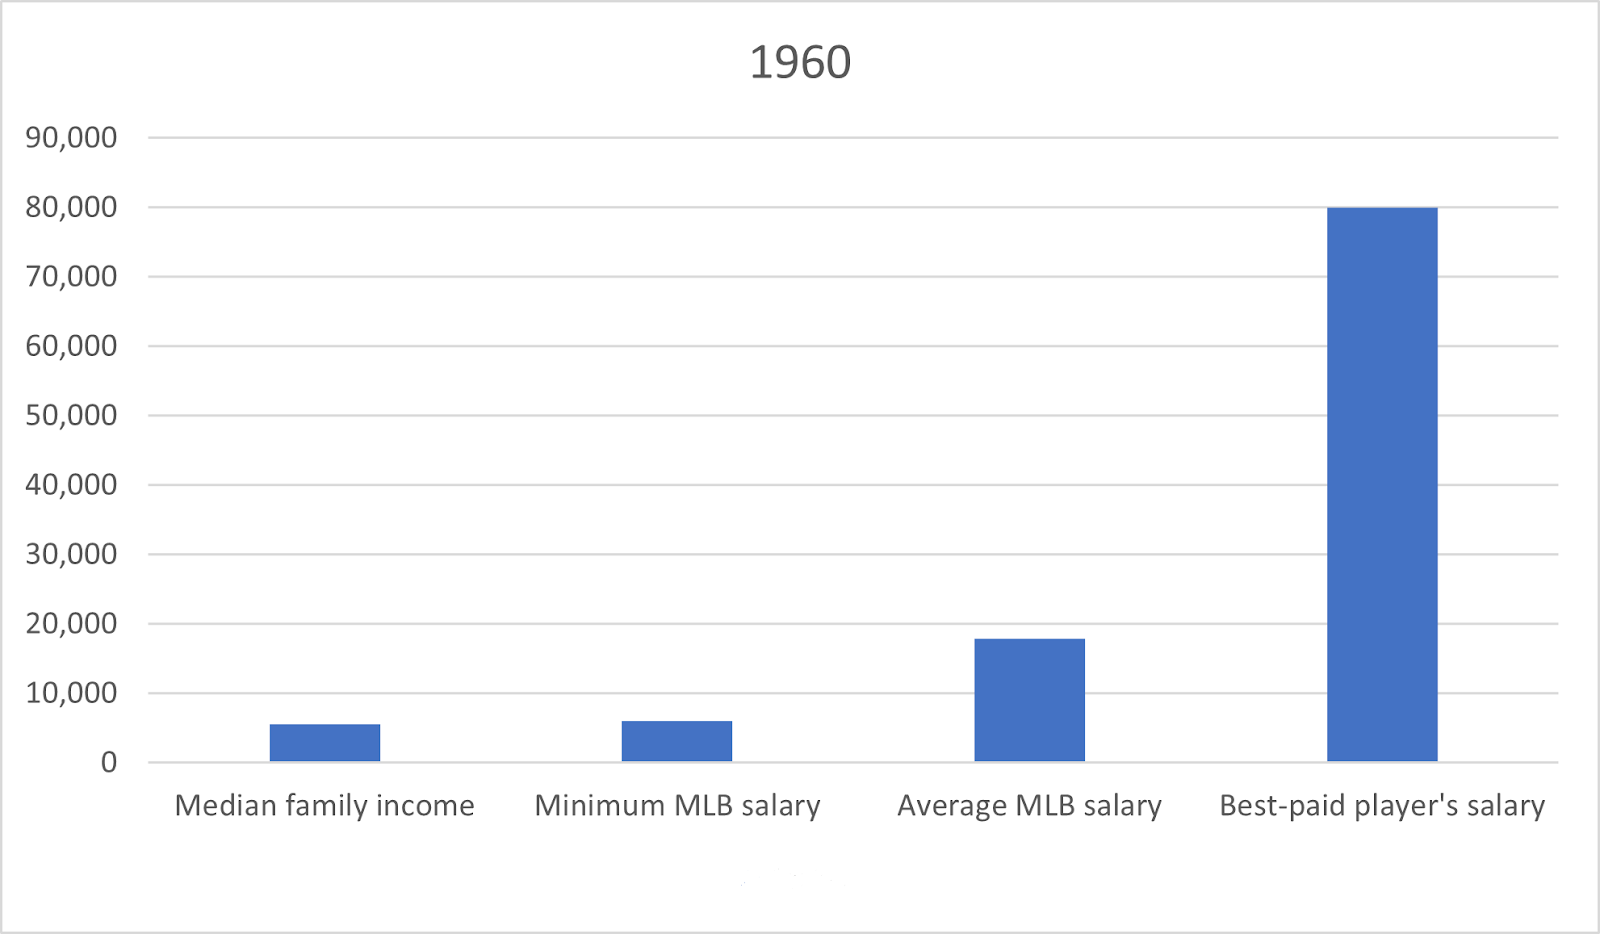
MLB Salaries (Top, Average, and Minimum) Compared to Family Income, 1960-2020

Salaries of Top-Performing Baseball Stars Double During the 1960s
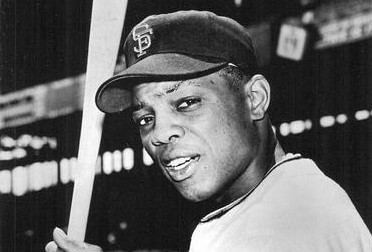
In 1960, salaries for high-performing professional baseball players were around $60,000. Baseball legend Willie Mays led the League—as he would do on multiple occasions throughout his career—with a then-record-breaking salary of $80,000, Baseball Reference reported.
It doesn’t take a mathematician to see that this salary is a lot less than the highest-paid baseball stars make today, but still, that raw data only tells us so much. We need to put it in context to make sense of what it really means.
1960s Benchmarks
Let’s travel back in time to 1960. The federal minimum wage was only $1, according to the University of Missouri Library. Gasoline cost $0.31 per gallon, the U.S. Energy Information Administration reported. You could buy a half-gallon of milk for $0.52, and the retail cost for the average quantity of meat products bought to feed a family for a year was just $284, according to the U.S. Department of Agriculture’s records. The average ticket price to attend a baseball game (in 1964, the first year for which such data is available) was $2.25, according to the Economic History Association.
The median home value was just $11,900, the United States Census Bureau reported. The average median income for families (as reported by the Census Bureau)—$5,600—sounds ridiculously small by today’s standards.
The best-paid baseball players in 1960 made more than 10 times what the average family earned in a year. These stars could afford multiple homes (if they wanted them) and other luxuries—but their earnings were still much closer to that of “regular people” than today’s highest-paid baseball stars.
Differences in MLB Players’ Earning Potential
Not all professional baseball players were so well-off, especially at the time. In 1960, the average salary for National League baseball players was $17,934, the Society for American Baseball Research reported. That’s still more than three times what the average family earned in a year, but far from the multimillion-dollar gap that separates today’s average earners from today’s average Major League Baseball salary.
If you can calculate an average salary, you can also assume that some salaries fall below that average rate. The MLB’s minimum salary data isn’t readily available for 1960, but by 1967, it was just $6,000. At that time, the total annual budget for a family of four with a moderate living standard was over $9,000.
The lowest-paid Major League Baseball players in the 1960s weren’t exactly living a life of luxury. If they wanted to keep pace with the lifestyles of the middle class, many professional baseball players in the 1960s had to get jobs in the off-season.
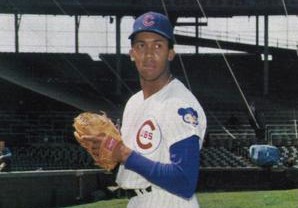
Notably, some multi-talented baseball players played other sports professionally during baseball’s off-season. Chicago Cubs pitcher Ferguson Arthur “Fergie” Jenkins played basketball for the Harlem Globetrotters from 1967 through 1969, as St. Louis Cardinals pitcher Robert “Bob” Gibson had done a decade earlier. Both Jenkins and Gibson would later command some of the then-highest salaries in the League.
In today’s dollars, the $60,000 ballpark (pun intended) salary for top-performing baseball players in the 1960s amounts to more than $580,000, and Willie Mays’ reported $80,000 salary adjusts to more than $770,000. That’s still a lot of money, especially compared to the $54,000 that represents what the average family’s income from 1960 would equal today, but it’s just a tiny fraction of what today’s baseball stars are earning.
In 1962, Mickey Mantle became the highest-paid baseball player—briefly, before Willie Mays reclaimed the title—with an annual salary of $90,000, according to the Society for American Baseball Research. Mantle would earn a $100,000 annual salary for most of the remaining decade.
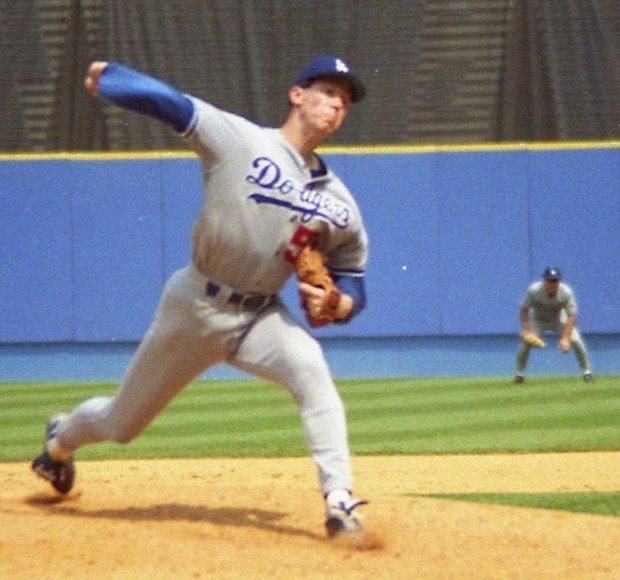
By 1965, Los Angeles Dodgers pitcher Sandy Koufax was earning $110,000 per year. Just 10 years before he started pulling this six-figure salary, he had been one of the MLB players earning $6,000 a year. Koufax’s baseball salary would climb to $125,000 in 1966.
Bob Gibson of the St. Louis Cardinals made $85,000 in 1968, and his earnings would only go up from there. By 1969, he, too, was earning $125,000.
Willie Mays was a top-earning baseball player throughout the ‘60s. By 1966, he was earning $105,000 per year. In 1969, he, like Koufax and Gibson, earned a reported $125,000.
Top Baseball Salaries Reach the Hundreds of Thousands of Dollars Range in the 1970s
Through the first half of the 1970s, earning potential for the best baseball players continued to shoot upwards. Gibson’s $125,000 salary in 1969 would grow to $150,000 in 1971, then $160,000 in 1973, and finally $175,000 in 1975.
The best-paid player of 1971 and 1972, Carl Yastrzemski, earned $166,667 during these years. In the latter half of the ‘70s, his income would climb as high as $375,000.
Dick Allen earned the highest salary in 1973 and 1974, when the Chicago White Sox paid him $200,000. Henry “Hank” Aaron was the best-paid baseball star in 1975 and 1976, earning $240,000 per year from the Milwaukee Brewers.

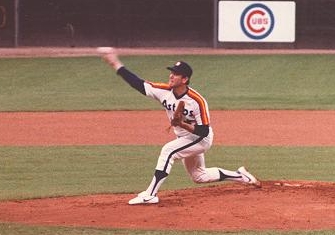
Pitcher Mike Marshall went from earning just $13,500 playing for the Seattle Pilots in 1969 to $135,000 playing for the Los Angeles Dodgers in 1976. By 1979, he was making $300,000 playing for the Minnesota Twins.
Between 1976 and 1977, the highest baseball salary more than doubled—from Hank Aaron’s $240,000 to the $560,000 salary paid by the Philadelphia Phillies to Mike Schmidt. Schmidt would continue to lead League salaries not only the following year but throughout the first half of the 1980s.
In 1973, Steve Carlton was earning $165,000 pitching for the Philadelphia Phillies—not bad for a baseball player who had started out making just $4,500 in 1965 playing for the St. Louis Cardinals, although nowhere near as lucrative as the seven-figure annual salaries he would be making in the early- to mid-1980s. Similarly, Mike Marshall was earning $300,000 pitching for the Minnesota Twins in 1979, a far cry from the $13,500 salary he received from the Seattle Pilots in 1969.
Fergie Jenkins started the ‘70s earning $62,000 per year pitching for the Chicago Cubs, but by the end of the decade, he would more than triple his salary to earn $200,000 playing for the Boston Red Sox.
Then there’s New York Mets pitcher Tom Seaver, who in 1967 was earning a modest baseball salary of $10,000. His earnings doubled between 1969 ($40,000) and 1970 ($80,000). By 1972, Seaver would be making $120,000 per year, and 1973 would bring another income boost raising his salary to $173,000. In 1976, Seaver’s salary broke the $200,000 benchmark, and the 31-year-old was making $225,000. He would end the decade with another $150,000 per year pay increase, now playing for the Cincinnati Reds and making $375,000 at age 34.
The salary progression Seaver had made during the 70s was significant, but 1979 brought an even bigger milestone for baseball salary raises.
A four-year, $4.5 million free-agent contract was awarded to pitcher Nolan Ryan by the Houston Astros in November 1979. Ryan became the first baseball player in history to earn a salary that topped $1 million per year, according to the National Baseball Hall of Fame. The massive annual salary was astonishing not only because it was the largest baseball salary in history at the time but also because of how much it had grown in such a short time—from earning just $3,600 in 1966 to $100,000 in 1974 and then $200,000 in 1977.
What about players with less lucrative salaries? The average salary of MLB players was $29,303 in 1970 and $44,676 in 1975, and the minimum salary for MLB players during these years was $12,000 and $16,000, respectively.
1970s Benchmarks
By 1974, the federal minimum wage was $2, according to the U.S. Department of Labor. Gasoline prices at the start of the decade were $0.36 per gallon and had climbed to $0.86 per gallon by the end of the decade. Tickets to a baseball game cost $2.72 in 1970 and had climbed to $4.12 by 1979. The median home value in the United States in 1970 was $17,000.
The average family income in 1970 was $9,870, the Census Bureau reported. The best-paid baseball players in 1970 earned an annual salary that amounted to more than 16 times the average family’s earnings.

Top Baseball Salaries Surpass $1 Million in the 1980s
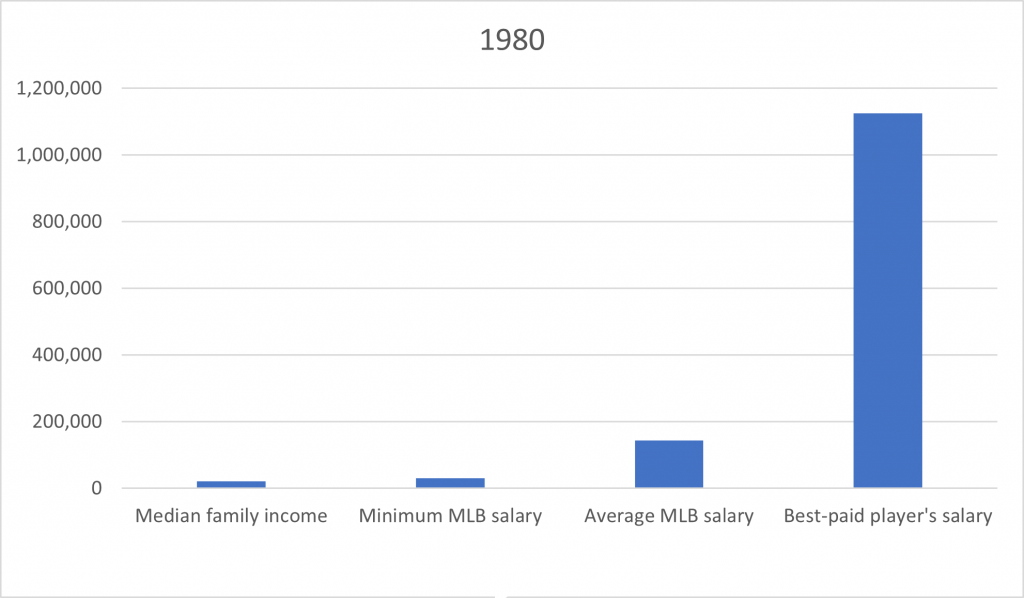
The million-dollar-per-year contract awarded to Nolan Ryan at the end of 1979 would begin with the 1980 baseball season, during which Ryan earned $1,125,000. He may have been the only player making a million dollars a year in 1980, but before long, other outstanding baseball stars would also be earning seven figures.
Mike Schmidt was the highest-earning baseball player from 1982 through 1985, with his annual salary rising each year from $1,500,000 up to $2,096,967. Other top players, too, would rake in million-dollar salaries during the ‘80s.
Remember Tom Seaver, who in the 1970s became one of the first baseball players to make multiple hundreds of thousands of dollars per year? In 1983, having returned to the New York Mets, 38-year-old Seaver would enjoy an annual salary that was once unthinkable: $850,000. Seaver took a brief pay cut—down to $750,000—upon joining the Chicago White Sox, but it wouldn’t last long. In 1985, he earned his first million-dollar annual salary, which topped $1,136,000.
Steve Carlton, too, would reach the height of his earning potential in the 1980s. In 1981, he began earning $725,000 per year. His earnings increased by another $100,000 in 1982, and from 1983 through 1986, he made $1,000,000 or more each year, topping out at $1,125,000 in ‘83.
Atlanta Braves pitcher Bruce Sutter was earning more than $1,354,000 a year by 1985 and would earn more than $1,729,000 each year from 1986 through 1990. That’s a big jump from the $50,000 he had earned in 1977 while playing for the Chicago Cubs.
Another player to earn upwards of $1 million in the ‘80s was John Denny, who made more than $1,109,000 pitching for the Philadelphia Phillies in 1985 and $1,083,000 pitching for the Cincinnati Reds in 1986.
By 1989, then playing for the Texas Rangers, Nolan Ryan would receive an annual salary of $1,800,000.
For eight years running in the 1980s, Los Angeles Dodgers pitcher Fernando Valenzuela would make seven-figure salaries, climbing to $2,050,000 in 1988. Rick Sutcliffe’s $1,260,000 salary in 1985 completely overshadowed the mere $55,000 salary with which he had started the decade. Throughout the years he played for the Chicago Cubs, he made a million dollars or more annually, raking in $2,340,000 in 1989.
In the late ‘80s, top earners Jim Rice, Ozzie Smith, and Orel Hershiser and Frank Viola (tied) would command salaries of $2,412,500, $2,340,000, and $2,766,000, respectively.
Looking beyond the most lucrative salaries, MLB players at more modest earning thresholds were seeing their income rocket upwards, as well. The average salary of MLB players was $143,756 in 1980 and $371,571 in 1985, while the minimum salary for MLB players during these years was $30,000 and $60,000.
1980s Benchmarks
In 1980, the federal minimum wage rose to $3.10. Americans paid $1.19 for gasoline in 1980—$1.25 for unleaded—and had actually declined to just under $1 per gallon by 1989. The cost of tickets to a Major League Baseball game throughout the ‘80s rose from $4.45 in 1980 to $6.21 in 1988. By 1980, the median home value nationwide had risen to $47,200.
For 1980, the Census Bureau reported a median family income of $21,020. This means that the best-paid baseball players in 1980 made more than 53 times what the average family earned in a year.
Multimillion-Dollar Annual Baseball Salaries in the 1990s
Baseball skills worth a million dollars in the 1980s would undoubtedly be worth twice that much—or more—in the ‘90s, wouldn’t they?
Rick Sutcliffe’s highest-earning year was 1993, when he made $2,500,000 playing for the Baltimore Orioles. The early 1990s saw Nolan Ryan achieve annual salaries in the $3,000,000 and $4,000,000 range.
Orel Hershiser was another player who made multimillion-dollar salaries throughout the 1990s. His highest salaries were $4,333,333 paid by the Los Angeles Dodgers in 1992 and 1993, but he also earned $3,100,000 in 1997 playing for the Cleveland Indians, 3,720,000 in 1998 playing for the San Francisco Giants and $2,500,000 in 1999 playing for the New York Mets.
Playing for the Kansas City Royals in the early 1990s scored Mark Davis multiple multimillion-dollar annual salaries, including earnings of $3,625,000 in 1991 and 1992.
The first $3 million salaries—$3,200,000 to Robin Yount and $3,800,000 to Darryl Strawberry— emerged in 1990 and 1991, respectively.
Dwight Gooden had been making more than $2,416,000 playing for the New York Mets by the end of the ‘80s, but he would really hit his peak earning potential in the early ‘90s. In 1992, his salary climbed to more than $5,166,000 per year, and 1993 saw his earnings top out at a massive $5,916,667.
Doug Drabek earned annual salaries of more than a million dollars from four different teams in the 1990s, including salaries of $5,000,000 or more paid by the Houston Astros in 1995 and 1996.
Bobby Bonilla was ranked as the highest-paid baseball player from 1992 through 1994, with a salary in the $6,000,000 range (and increasing) each year.
By the late 1990s, Tom Glavine would be earning $7,000,000 per year pitching for the Atlanta Braves.
Cecil Fielder topped the list of the highest-earning players in ‘95 and ‘96, with a salary of $9,237,500. In 1997, Albert Belle became the first baseball player to earn a $10,000,000 annual salary—and he was far from the last to do so in the late ‘90s.
Greg Maddux, for example, was already earning $2,400,000 in 1991 playing for the Chicago cubs, and his income potential would keep climbing over the course of the decade, most of which he spent playing for the Atlanta Braves. His salary topped $5,000,000 in 1993, $6,000,000 in 1995, and $9,000,000 in 1998. By the end of the decade, Maddux was earning $10,600,000.
Gary Sheffield would claim the title of the highest-paid baseball player in 1998, with a salary of $14,936,667.
The average salary of MLB players was $578,930 in 1990 and rose to $1,071,029 in 1995. The minimum salary for MLB players during these years was $100,000 and then $109,000.
[Jump to our focus on salary inflation in professional hockey.]
1990s Benchmarks
The 1990s saw four federal minimum wage increases: $3.80 in 1990, $4.25 in 1991, $4.75 in 1996, and $5.15 in 1997.
Regular gasoline switched from leaded to unleaded in the ‘90s. In 1991, Americans paid $1.14 in nominal dollars per gallon of unleaded gasoline. Gas prices reached a high point for the decade in 1997, at $1.23 per gallon, before declining to $1.17 by 1999. If you wanted to go to a baseball game in the ‘90s, your price would range from a little under $9 per ticket in 1991 to $14.45 per ticket in 1999. The median home value in 1990 had climbed to $79,100.
The median family income in 1990 was $29,943, according to the Census Bureau. The best-paid baseball players in the early 1990s earned upwards of 203 times the average family’s annual income.

(Notice how the bar that represents the median family income is so small in comparison to the best-paid player’s salary that it has virtually disappeared from visibility on the chart above?)
[Jump to our focus on salary inflation in professional basketball.]
Star Players Earned Salaries in the Tens of Millions in the 2000s
The new millennium saw baseball salaries climb even higher and even faster. Kevin Brown was the highest-paid player in 2000, earning $15,714,286, but that already astronomical salary would double within a decade for the highest-performing players.
After three years of near-eight-figure earnings, Tom Glavine would earn $11,000,000 from the New York Mets in 2003 and nearly that much in 2004 and 2005.
John Smoltz, whose earnings in the late ‘90s while playing for the Atlanta Braves had surpassed $7,700,000, would see his salary potential continue to rise throughout the 2000s. Smoltz earned annual salaries of $11,000,000 or more in 2004 and again in 2006, and in 2008, he made $14,000,000.
Greg Maddux earned his top salary, $14,750,000, in 2003.
Randy Johnson spent most of the 2000s decade earning eight-figure baseball salaries, first from the Arizona Diamondbacks and then from the New York Yankees. In both 2004 and 2005, he earned his top salary of $16,000,000.
From 1999 through 2008, Pedro Martínez earned annual salaries of more than $10,000,000 every single year, first playing for the Boston Red Sox and then for the New York Mets. Martinez’s highest-earning year was 2004, during which he made $17,500,000.
In 2005, Roger Clemens saw his highest ever annual salary, $18,000,000, while playing for the Houston Astros. The New York Yankees would pay him almost as much in 2007. Clemens had first made over $1,000,000 in 1988 and was earning $10,300,000 annually by 2001.
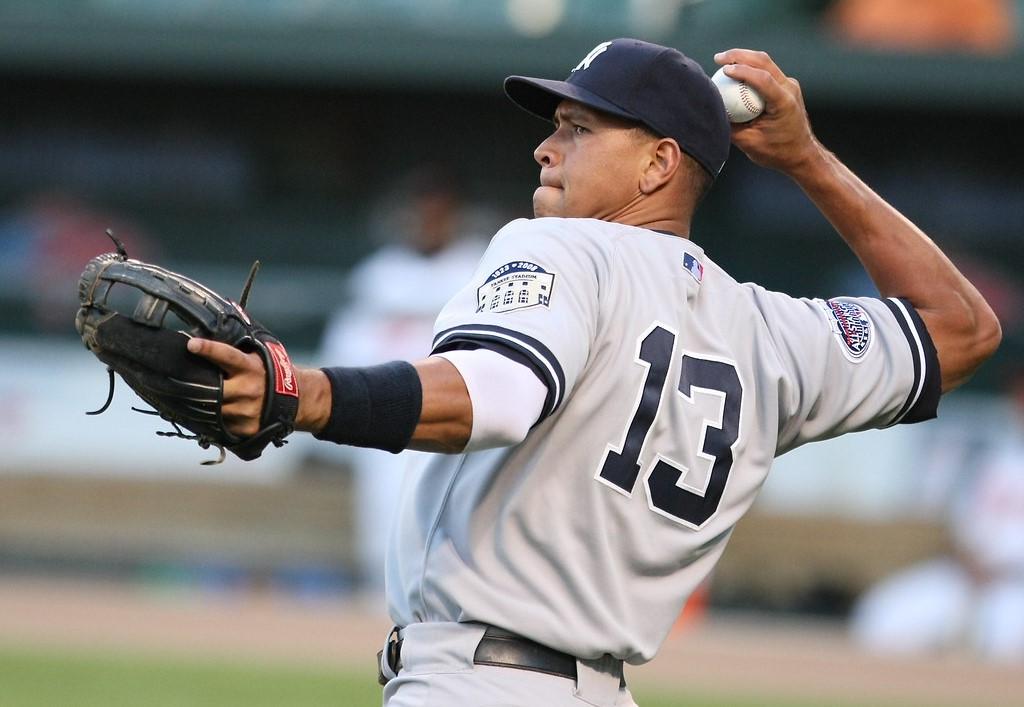
Throughout the 2000s, the highest salaries of the year climbed into the $20,000,000 and $30,000,000 ranges. These high points were driven largely by the lucrative and often record-breaking salaries paid to Alex Rodriguez: $22,000,000 from 2001 through 2003, $26,000,000 in 2005, $28,000,000 in 2008, and $33,000,000 in 2009. In 2007, Jason Giambi claimed the highest salary, earning $23,428,571 from the New York Yankees.
Both minimum and average salary rates for MLB players increased numerous times during this decade. The average MLB salary rose to $1,998,034 in 2000, $2,632,655 in 2005, $2,699,292 in 2007 and $2,996,106 in 2009. The minimum salary was set at $200,000 in 2000, climbing to $300,000 in 2002 and eventually, in 2009, $400,000.
2000s Benchmarks
In 2007, the federal minimum wage increased for the first time in almost a decade, up to $5.85 per hour. Minimum wage would rise again over the next two years: to $6.55 in 2008 and $7.25 in 2009.
Gas prices more than doubled during the first decade of the new millennium. In 2000, the price for unleaded regular gasoline in nominal dollars was just $1.51. By 2008, gas cost more than $3 per gallon, although it subsequently dropped to $2.14 per gallon in 2009.
Tickets to a Major League Baseball game were getting more expensive in the early 2000s: $16.22 in 2000, $17.20 in 2001, and $17.85 in 2002. By 2008, the cost of one ticket was more than $25, Statista reported.
By the year 2000, the median home value in the United States was up to $119,600.
The median income for families in 2000 was $42,148, according to the Census Bureau. The best-paid baseball players in the first decade of the new millennium enjoyed salaries of more than 372 times what the average family earned in a year.

$30 Million Salary Ranges in the 2010s
The highest baseball salary paid in 2010, $33,000,000 to Alex Rodriguez, more than doubled the highest salary paid in the League just 10 years prior.
That’s not to say that making $15,000,000 per year wasn’t a big deal during the 2010s—Chris Carpenter achieved his highest annual salary, $15,840,971, pitching for the St. Louis Cardinals in 2010—but these figures that had so recently landed players a spot on the best-paid list were no longer so exceptional in the sport.
In the first few years of the new decade, Rodriguez continued to claim the highest-earner title with salaries at or near the $30,000,000 range. He wasn’t alone in pulling these huge sums, either. Zack Greinke was the highest-paid player in 2014, with a $28,000,000 salary. Clayton Kershaw spent three years at the top of the earnings list, making $31,000,000 in 2015 and $33,000,000 in 2016 and 2017.
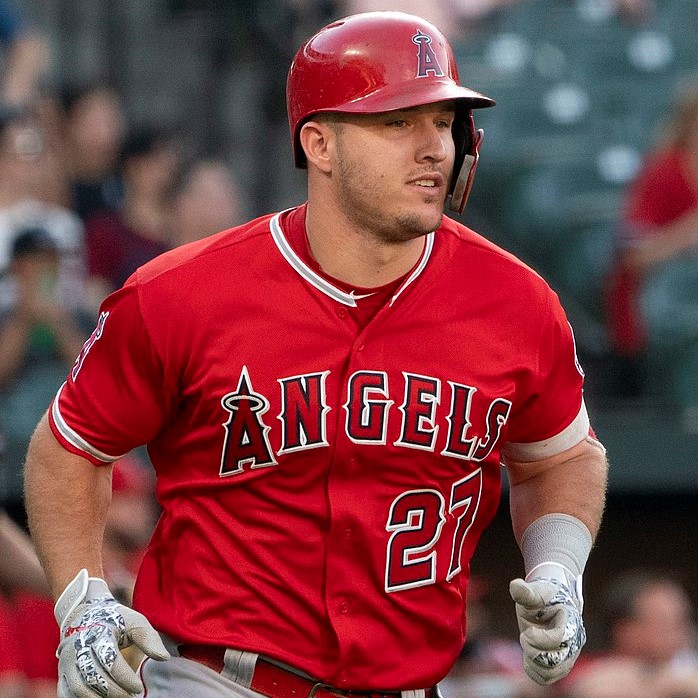
With a salary of $34,083,333, Mike Trout became the best-paid baseball player in the League for the first time—but not the last—in 2018. Closing out the 2010s, Stephen Strasburg claimed the title of the top-earning baseball player with a salary of $38,333,333.
The 2010s, again, saw numerous increases in MLB minimum salaries, although the decade also brought some unusual ups and downs in average salaries. The 2011 minimum salary of $414,000 increased to $480,000 in 2012, $507,500 in 2015, $535,000 in 2017, and $545,000 in 2018. The average MLB player salary of $3,650,000 in 2012 rose significantly to $4,250,000 in 2015 but then dropped to $4,097,000 in 2017 and saw another slight decline—to $4,095,000—in 2018.
[Jump to our focus on salary inflation in professional football.]
2010s Benchmarks
The federal minimum wage hasn’t risen since 2009. Gas prices remained variable—and noticeably higher than in previous decades—throughout the 2010s. In 2010, gas cost $2.79 per gallon, climbing to $3.53 in 2011. The U.S. Department of Energy reported that regular gasoline prices hit their high in 2013, at $3.62 per gallon, and ended the decade at $2.60. By the mid-2010s, the average cost of an MLB game ticket was $30. The unadjusted median home price in 2010 was $221,800.
The median household income in 2010 was $58,627. Despite the ups and downs in average MLB salaries, the highest-performing baseball stars playing for the MLB during the 2010s made more than 562 times the average family’s annual income.

The 2020s (So Far): A Decade of “Mega-Contracts”?
The first few years of the 2020s have seen $30,000,000 and near-$30,000,000 salaries become more prevalent. In 2020, Mike Trout once again became the best-paid MLB player with a $37,700,000 salary, part of a lengthy contract that would award him a total of $426,500,000 over 12 years. Not far behind him were Gerrit Cole, with a $36,000,000 salary, and Max Scherzer, with a $35,900,000 salary.
Huge salaries—often promised for the course of several years—plus signing bonuses that can amount to tens of millions of dollars in their own right have amounted to what Forbes called “mega-contracts” in 2021. By salary only, Mike Trout again topped the earnings list, with an income of $37,116,667. Gerrit Cole again followed close behind, with a $36,000,000 salary again, trailed by Nolan Arenado, with a salary of $35,000,000. Another nine players also had annual salaries at or above $30,000,000 in 2021.
For the 2022 baseball season, 14 players had contracts with salaries at or above $30,000,000, NBC reported. Max Scherzer was set to earn the highest salary for the year, at a record-breaking $43,333,333. Gerrit Cole would be earning $36,000,000, and Mike Trout’s expected salary was listed as $35,541,667.
By 2020, the average MLB player salary had dropped again, this time by a more substantial amount that put this figure back below $4,000,000. However, by 2022, the average salary would rise again, this time to a new record of $4,414,184. The lowest-earning MLB players would also see an income boost. The $563,500 minimum MLB salary in 2020 would grow to $700,000 in 2022 and is set to reach $780,000 by 2026.
[Jump to our look at the inflation of salaries in soccer on a global scale.
2020s Benchmarks
The first years of the 2020s again brought volatility in fuel costs. Gas prices rose from $2.17 per gallon in 2020 to more than $3 per gallon in 2021, and in the first quarter of 2022, USA Today reported that gas prices were “the most expensive in US history.” By the early 2020s, the average cost of a ticket to a Major League Baseball game was approaching $35.
The median home price in 2020 was $310,600, CNBC reported. Home prices rose by more than 23 percent between 2020 and 2021, hitting a record high median home price of $363,300, according to Newsweek.
The median household income in 2020 was $67,521, according to the Census Bureau. This means that top-earning baseball stars made more than 558 times what the average American family made in a year.

Conclusion
Although no one can say for sure what’s next for baseball salaries, it seems like a safe bet that this trend of more players reaching or surpassing that coveted $30,000,000 mark is likely to continue.
How long will it take $40,000,000 to become the next $30,000,000 benchmark? At what point will the highest salaries once again double the record-breaking earnings of 10 years or 20 years prior? With inflation as measured by the Consumer Price Index having recently hit a 40-year high, will the rate of baseball salary inflation go up even faster than it has in recent decades? We can only speculate, but based on the extreme rate of inflation we have seen in baseball salaries over the last 60 years, the future of Major League Baseball salaries will be exciting to watch.
***
Athletes and sports teams might make a fortune. But what about the cities where they play? Find out how sports stadium construction impacts local economies.