
In our quest to understand our economy’s heartbeat, we dive into what Americans spend the most money on. This insight not only reflects our collective priorities but also shapes the nation’s economic landscape. Join us as we unpack the spending habits that define and drive American life, even through unprecedented times.
Discretionary and Non-Descretionary Consumer Spending in America
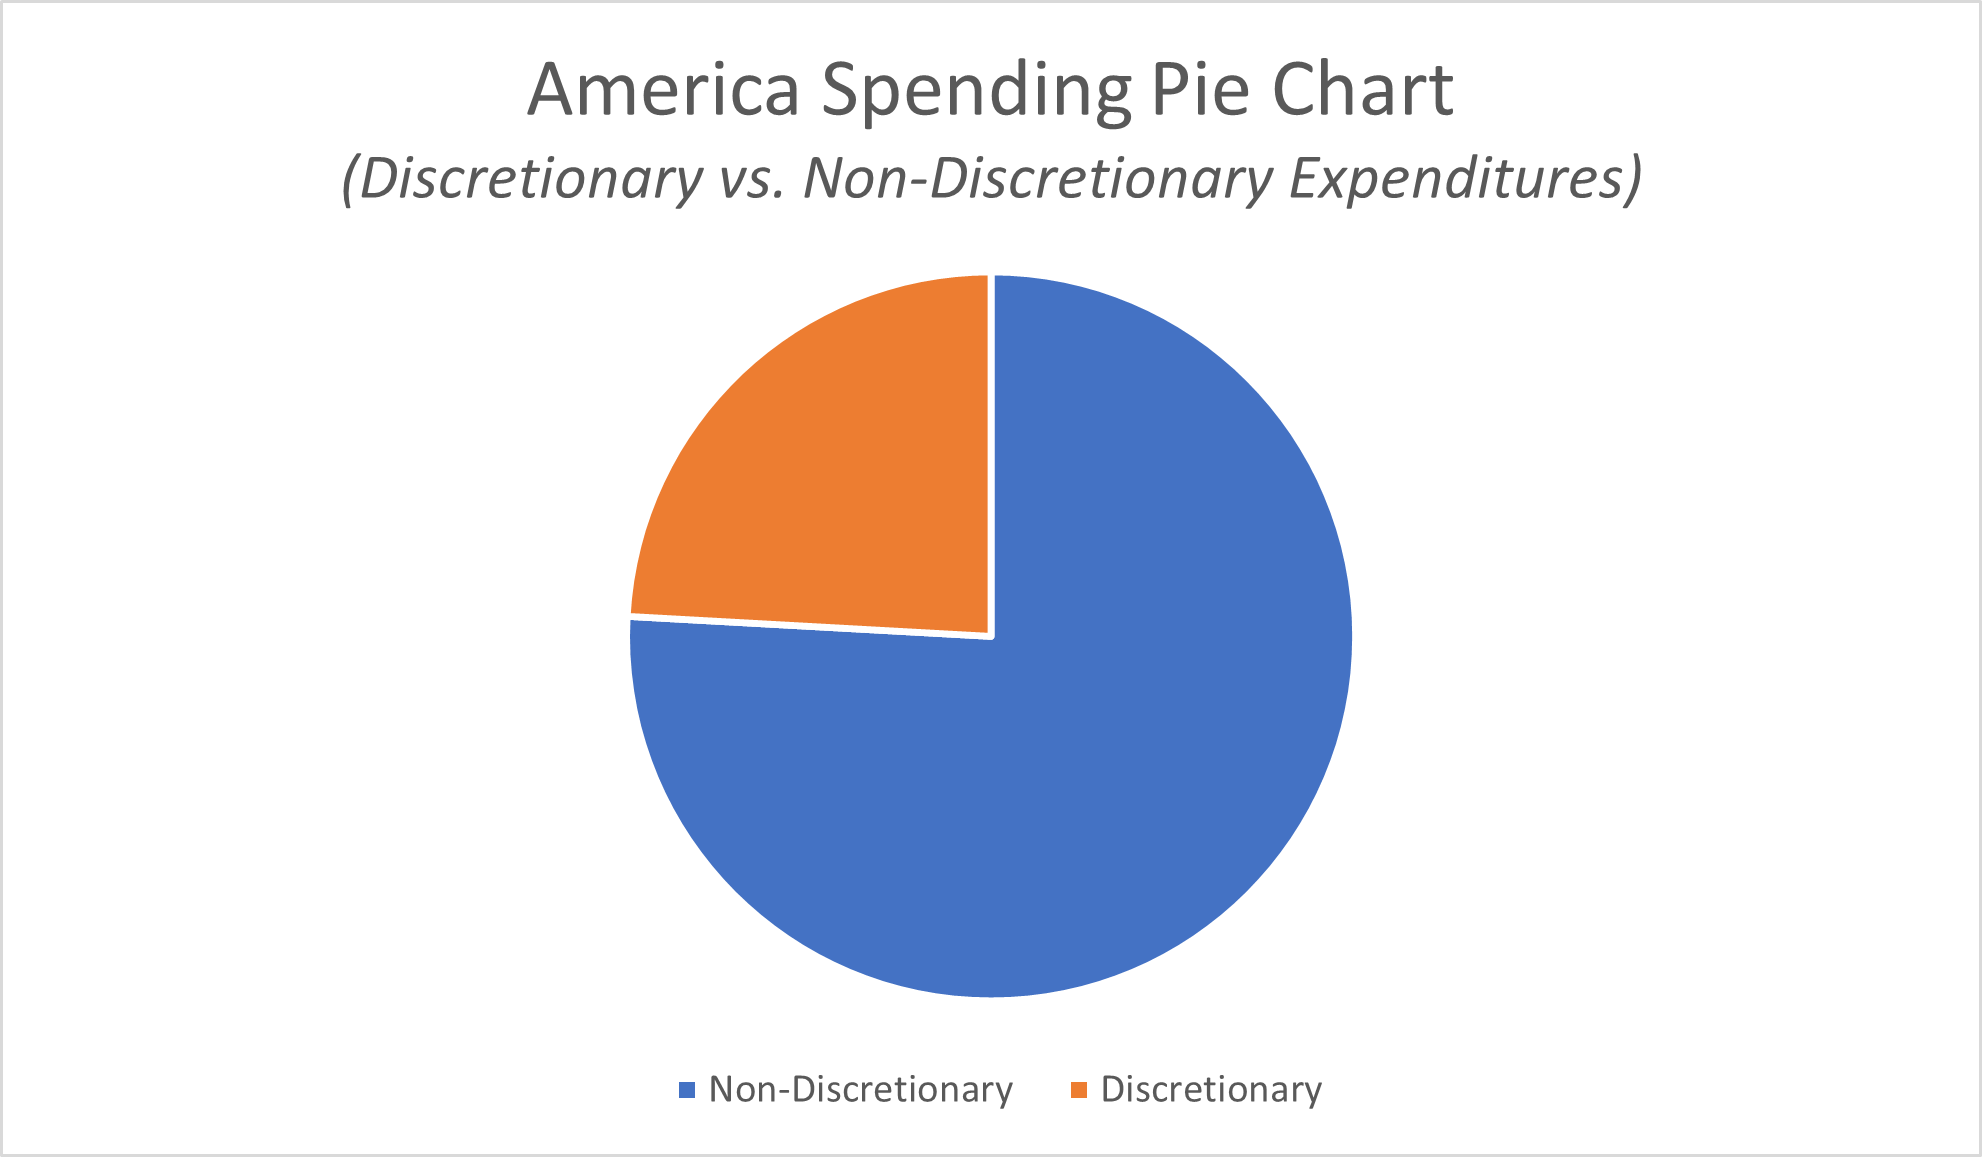
Before proceeding, I should note that consumer spending is typically divided into two broad categories—discretionary and non-discretionary spending.
Discretionary spending refers to non-essential expenses like home furniture, entertainment, recreation, travel, and other items and services which are generally optional. Non-discretionary expense refers to consumer spending on necessary goods and services including housing, healthcare, food, clothing, and transportation.
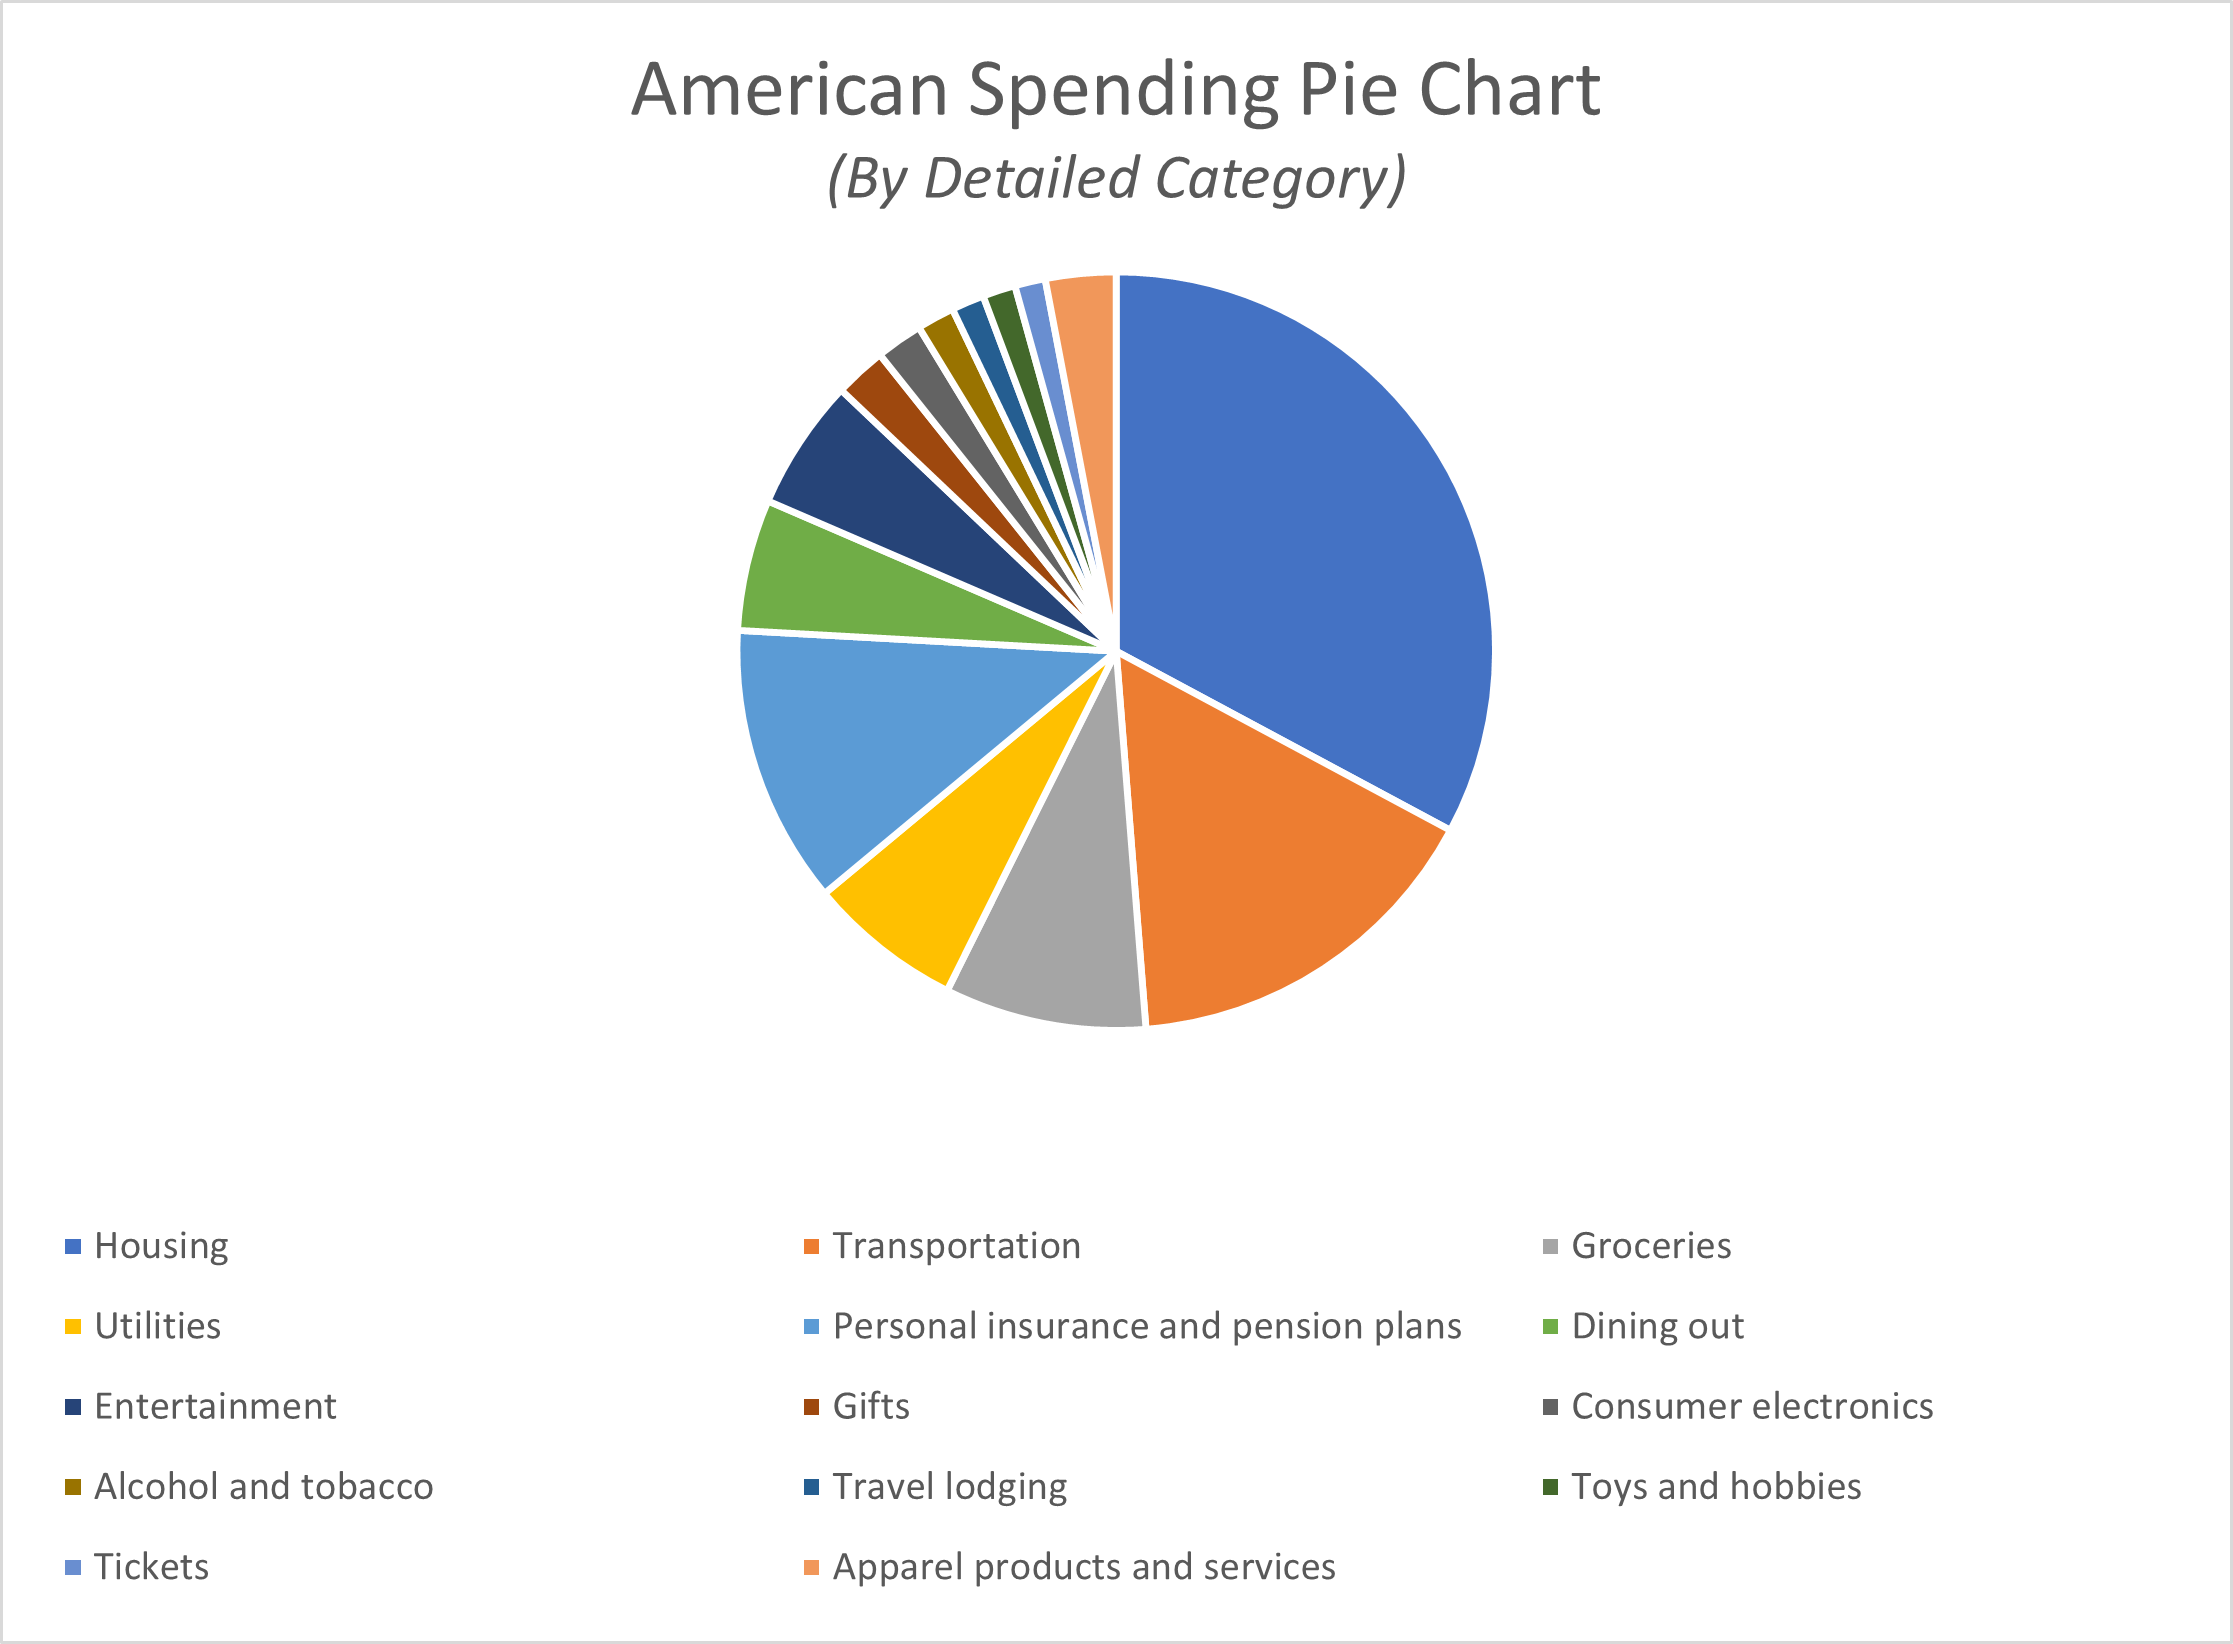
Which expenses make up the largest slivers of the whole pie?
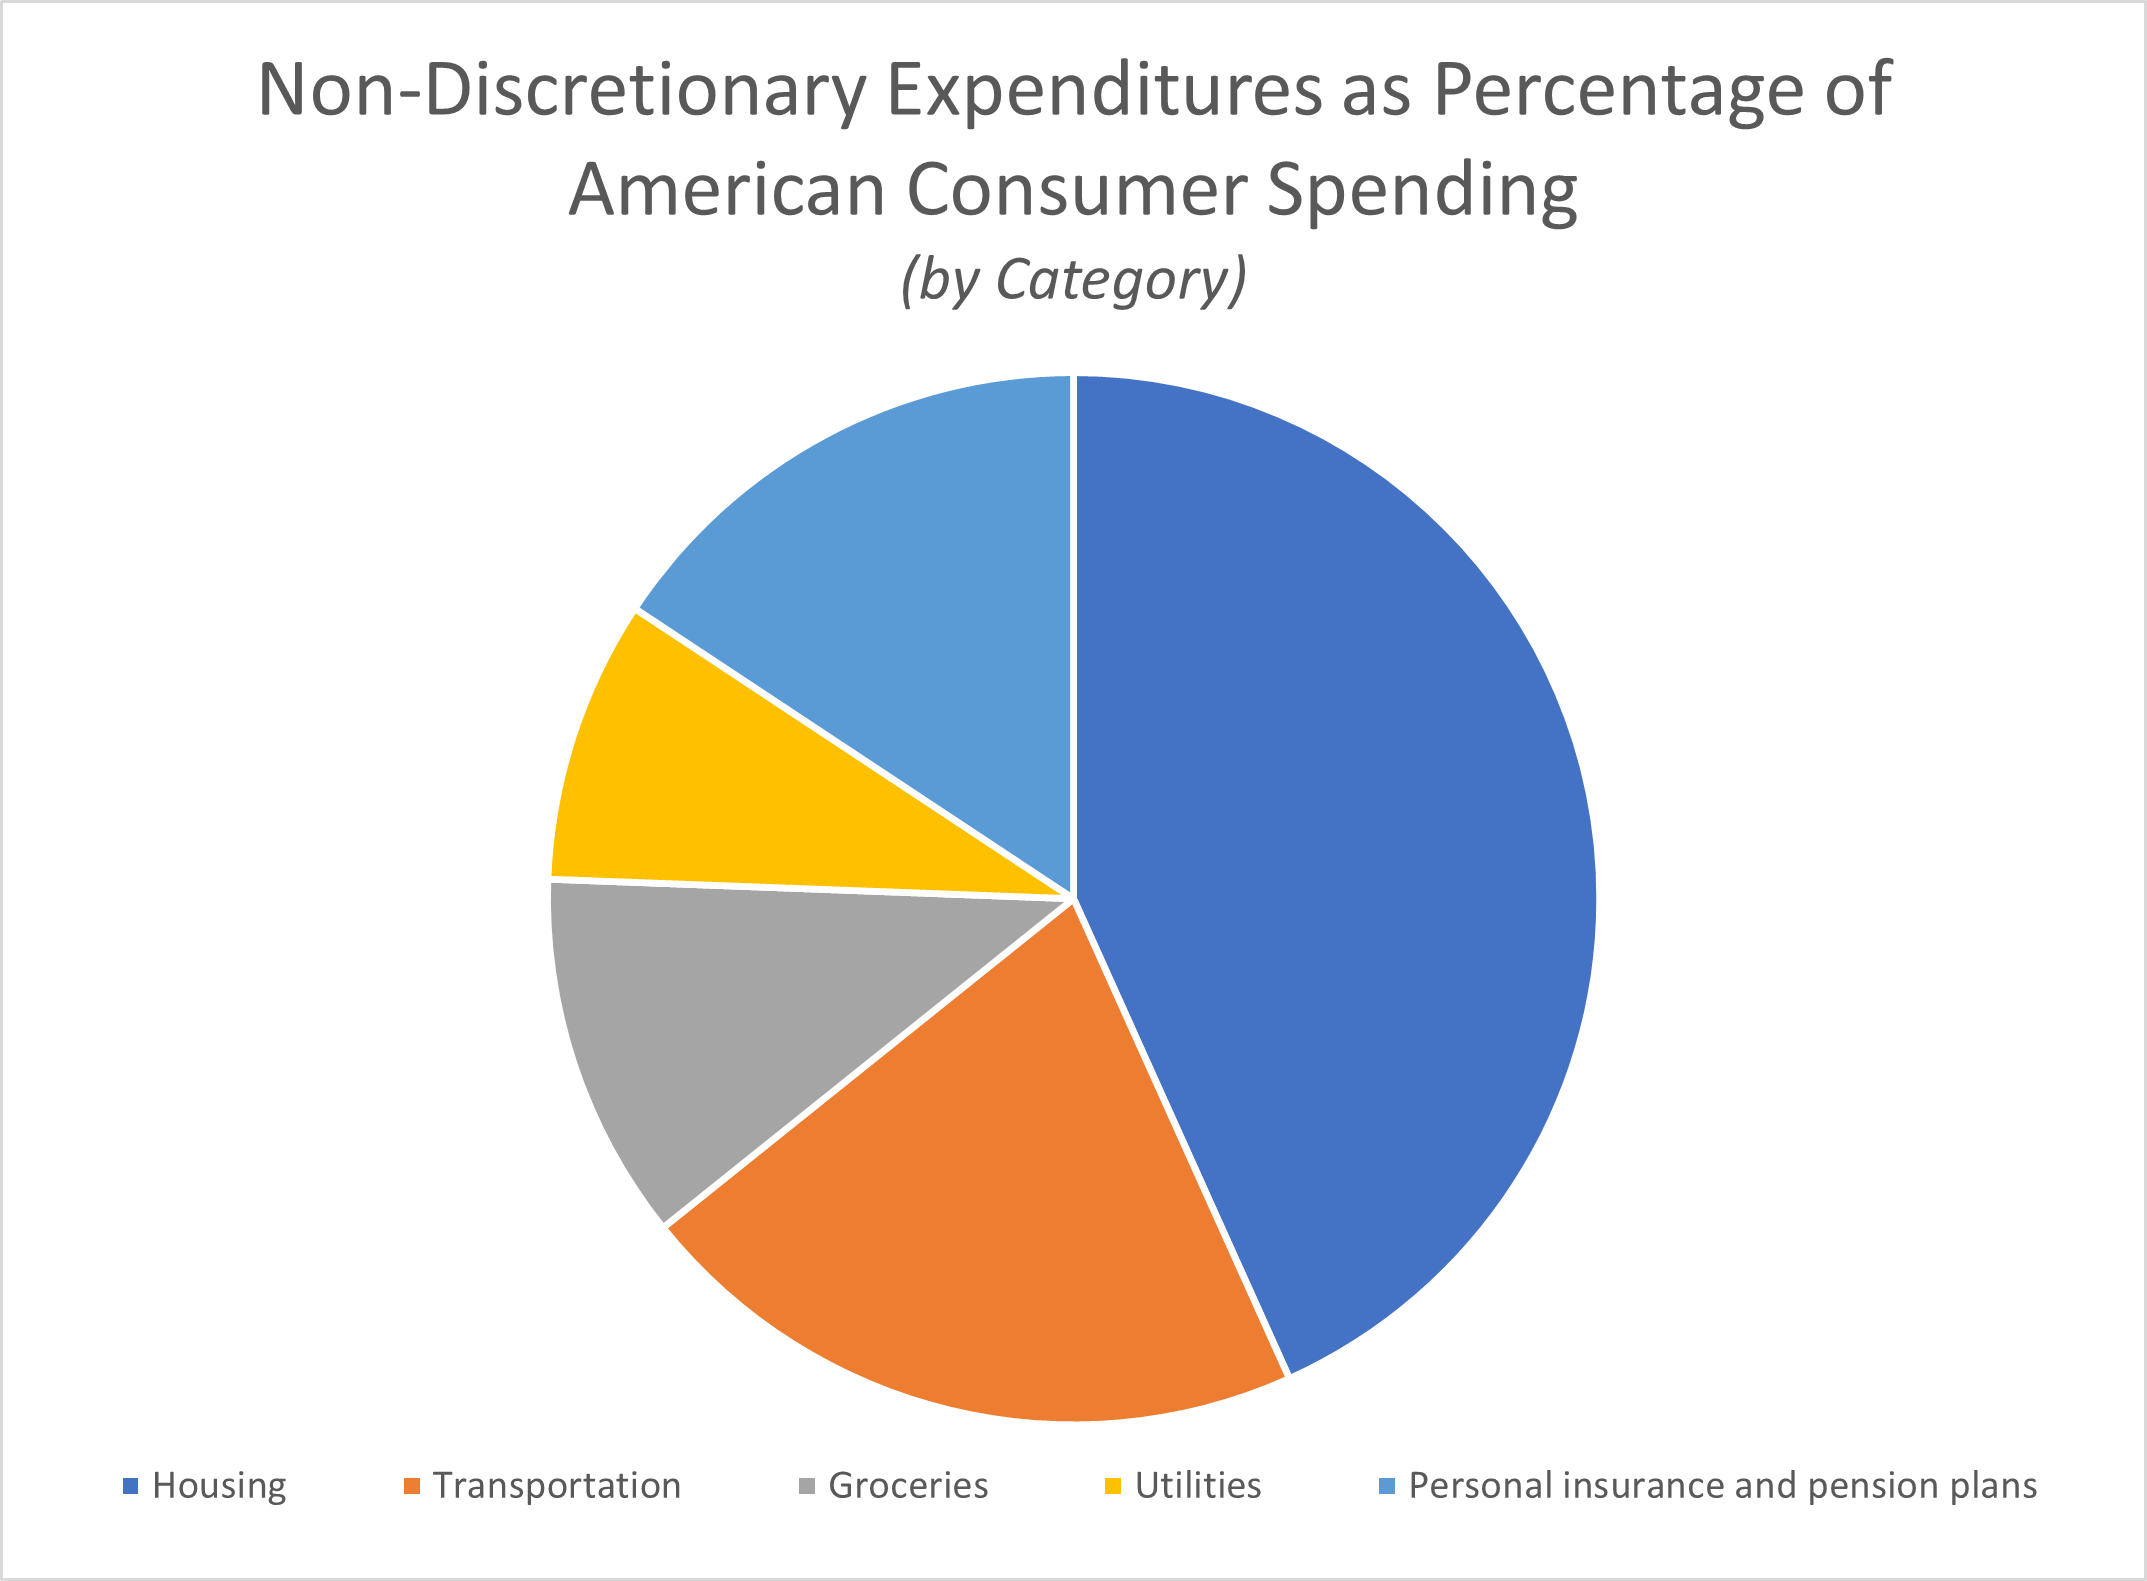
Non-Discretionary Expenses: Housing, Transportation, Healthcare, and More
Let’s first take a look at non-discretionary expenses, since these are the expenses for goods and services consumers have to have. How much does the average American spend on necessities?
The vast majority of Americans will dedicate well over 60% of their spending to non-discretionary expenses. As a result, it’s important to dive deeper into non-discretionary income spending habits—not just brush these off as unavoidable and unchangeable expenses—if you want to truly understand where and how Americans spend their money.
Most of the average household budget goes to needs, not wants. The figures below suggest that the high cost of living in the United States is a consequence of the burdensome costs imposed by the most consistent spending categories of non-discretionary expenses: housing, healthcare, and food.
What Is the Number 1 Expenditure for the US?
Shelter is a critical need for humans. You have to live somewhere, and for the average American—regardless of whether you rent, buy, or build a house—a place to live is the single largest expense. In fact, average Americans spend nearly a third of their total annual spending on a place they can call home.
According to a 2020 U.S. Bureau of Labor Statistics report on Consumer Expenditures (which references figures from 2018), the top expense among American consumers in either category of discretionary or nondiscretionary expenditures is housing.
Rent and mortgage payments account for roughly 32.8% of all consumer spending. Also included in the housing expenditure category are the costs of property taxes, homeowners insurance, and repairs and maintenance.
This is a dominant expenditure for most Americans and (as a closer look below at housing markets in different major metropolitan areas demonstrates), the cost of shelter is a driving indicator of broader expenses in a given local market.
Therefore, the cost of housing is often proportional to other costs in a given city, demonstrating the highly variable nature of consumer costs by region. I’ll explore this matter in more detail hereafter.
What Average Americans Spend on Other Categories of Non-Discretionary Expenses
Other major categories of American consumer spending include:
- Transportation: 15.9% of the average annual expenditure for American consumers
- Groceries: 8.6% of the average annual expenditure for American consumers
- Healthcare: 8.1% of the average annual expenditure for American consumers
- Utilities: 6.6% of the average annual expenditure for American consumers
Transportation
The big spending category of transportation expenditures includes car payments and expenses related to buying a car or vehicle, fueling, and maintaining a vehicle, as well as taking public transportation like buses, trains, and air travel, as well as other forms of transportation.
Groceries
If a recent grocery shopping trip has left you with a hefty bill to pay, it might not surprise you to find that food prepared or consumed at home is a major spending category for the average household in America. Fruits, vegetables, meat, eggs, dairy products, bakery products, cereals, and other staples are among the categories covered under the groceries, or food at home, category.
Although shopping sales, using coupons, comparing prices and strategically using the best credit cards for buying groceries can all help cut down food costs and get consumers more for their money, food and groceries will continue to claim a solid chunk of consumers’ total average spend each year.
Health Care
Health care spending is another of the biggest expense categories for average Americans. In its definition of healthcare expenditures, the BLS includes consumer spending on health insurance premiums, health care and medical services, medical equipment and prescription and over-the-counter medications, vitamins, and supplements.
Utilities
Spending on utilities, fuels, and public services encompasses spending on electricity, natural gas and other fuel sources, water, sewage maintenance, telephone charges, and trash collection services.
Depending on their area of service, consumers may or may not have the opportunity to shop around for providers. However, they can take other steps to save on utilities, often by using more efficient equipment or otherwise reducing usage.
Personal Insurance and Pensions
In addition to these expenses, the Consumer Expenditures report notes that spending on Personal Insurance and Pension plans came in at 11.9% of spending in 2018.
Personal insurance expenses include premium costs for all sorts of personal insurance coverage, including life insurance, disability insurance, mortgage insurance, accident insurance, personal liability insurance, and car insurance.
In this category, you will also find contributions to retirement savings plans through Social Security, employer- and government-provided pensions or retirement plans, and IRA retirement plans for self-employed workers.
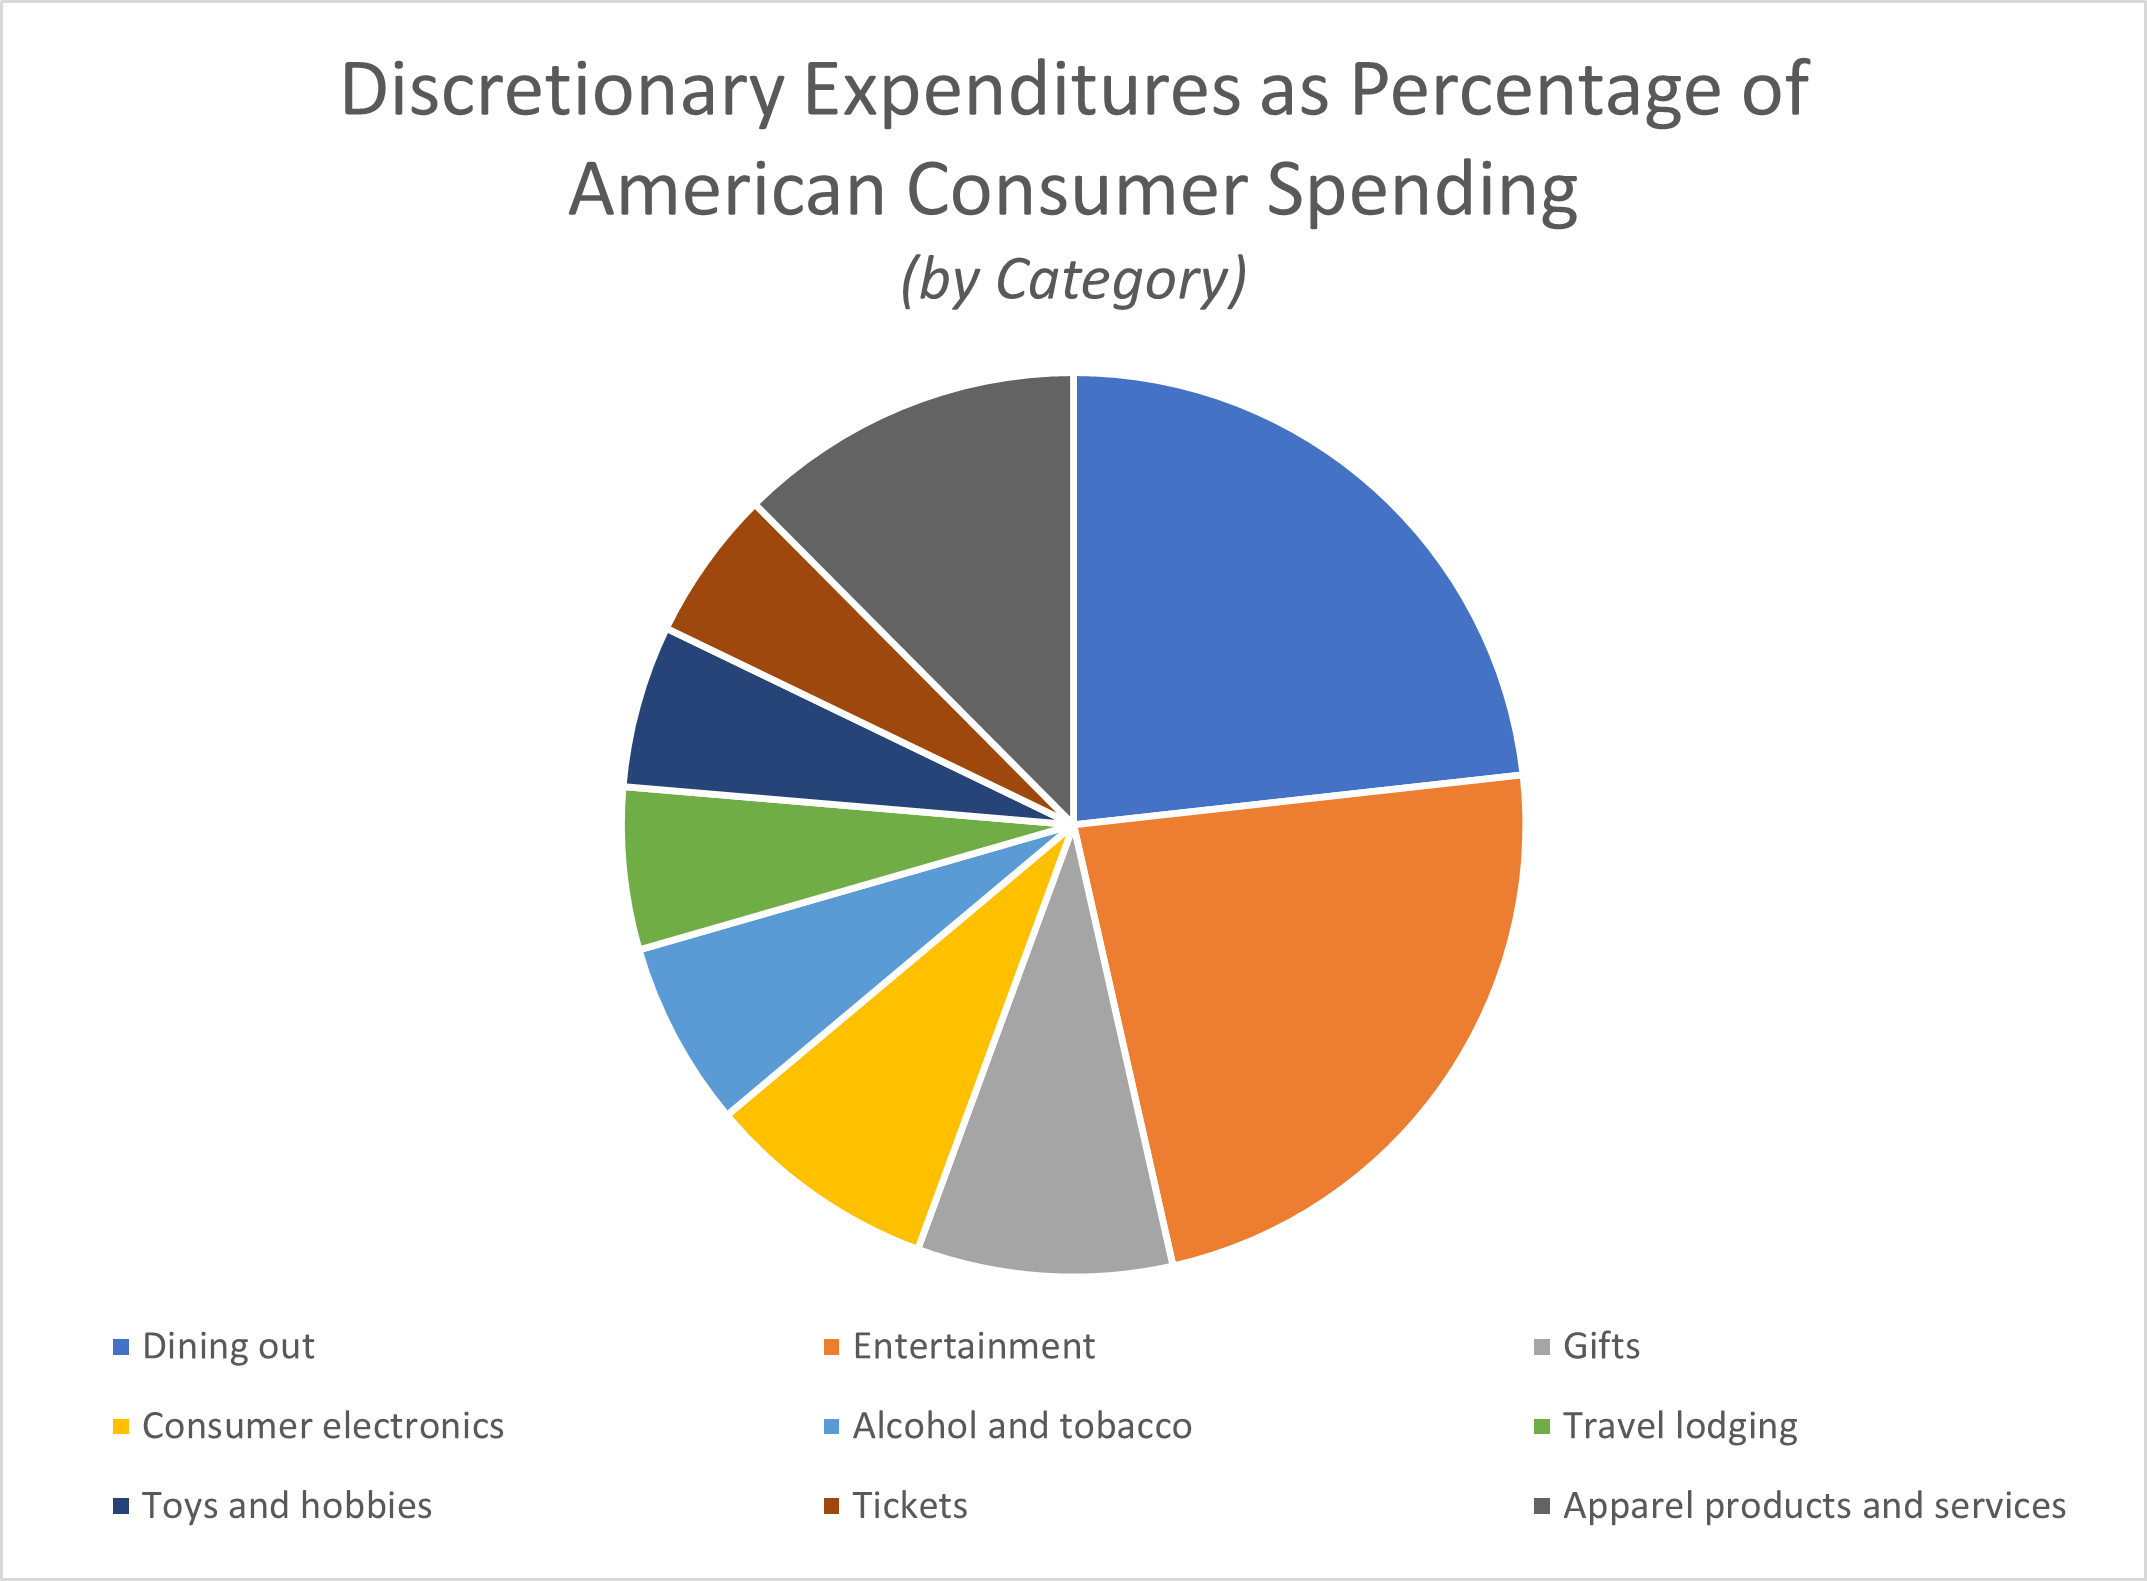
Discretionary Expenses
Now that I’ve seen how much the average American spent on the things they need, let’s look at how Americans spend their money on the things they want.
What Are Discretionary Expenditures?
This category of discretionary expenditures refers to elective spending on non-essential goods, services, and experiences. While these spending categories form a much smaller piece of the spending pie for most Americans, taken together, they constitute around a quarter of all spending per year.
The figures below are also drawn from the 2020 U.S. BLS report on Consumer Expenditures, and provide a breakdown of the top goods and services accounting for discretionary household spending in 2018.
The Biggest Spending Categories in Discretionary Purchases
Two spending categories led discretionary income spending in 2018, both coming in at 5.6% of the average household budget: dining out and entertainment.
Dining out includes spending at restaurants (and tipping your server), convenience stores, vending machines, and more.
According to Investopedia, the Entertainment spending category includes spending on things like sporting goods, bikes, hunting and fishing supplies, and other recreational equipment.
Additional discretionary expenses include:
- Gifts: 2.2%
- Consumer Electronics: 2%
- Alcohol and Tobacco: 1.6%
- Travel Lodging: 1.4%
- Toys and Hobbies: 1.4%
- Tickets: 1.3%
- Apparel Products and Services: 3%
Some of these spending categories could benefit from some further clarification. For instance, “Tickets” refers to spending on event attendance including sporting events, concerts, movie theaters, stage productions, wrestling tournaments, and more.
The category identified as “Toys and Hobbies” also includes playground equipment and pet supplies. As to the last of these, pet food and veterinary care actually account for the biggest proportion of the 1.4% itemized above.
The category of “Apparel Products and Services” includes expenses such as dry cleaning, clothing storage, jewelry and watch repair, tailoring, rental and more.
As the bulleted list above demonstrates, these expenses generally extend from the lifestyle priorities of American consumers.
Evidence suggests that a big source of fuel for the American economic engine is channeled through recreational activities that include the pursuit of entertainment, event attendance, vacations, physical activeness, hobbyist activities, and of course, your pets.
Spending Preferences in Major Cities
The figures above offer a look, by percentage, at all the things Americans work into their budget both out of necessity and desire. But these percentages only tell a part of the story. As noted at the outset, there are dramatic differences in the cost of living from one region to the next, and even between two cities in the same state.
How Housing Costs Compare Across Major U.S. Cities
To this point, Insider reports on “Bureau of Labor Statistics’ Consumer Expenditure Surveys per city. The data covers the most recent period of 2016 to 2017 and reveals average annual expenditures for consumer units 22 major metros in the Northeast, South, West, and Midwest.”
The findings show that the costs for food, housing and transportation (the “Big Three” American expenses) for 22 major cities demonstrate certain parallels but also show that the biggest difference in consumer spending from one major metropolitan area to the next largely comes down to the cost of housing.
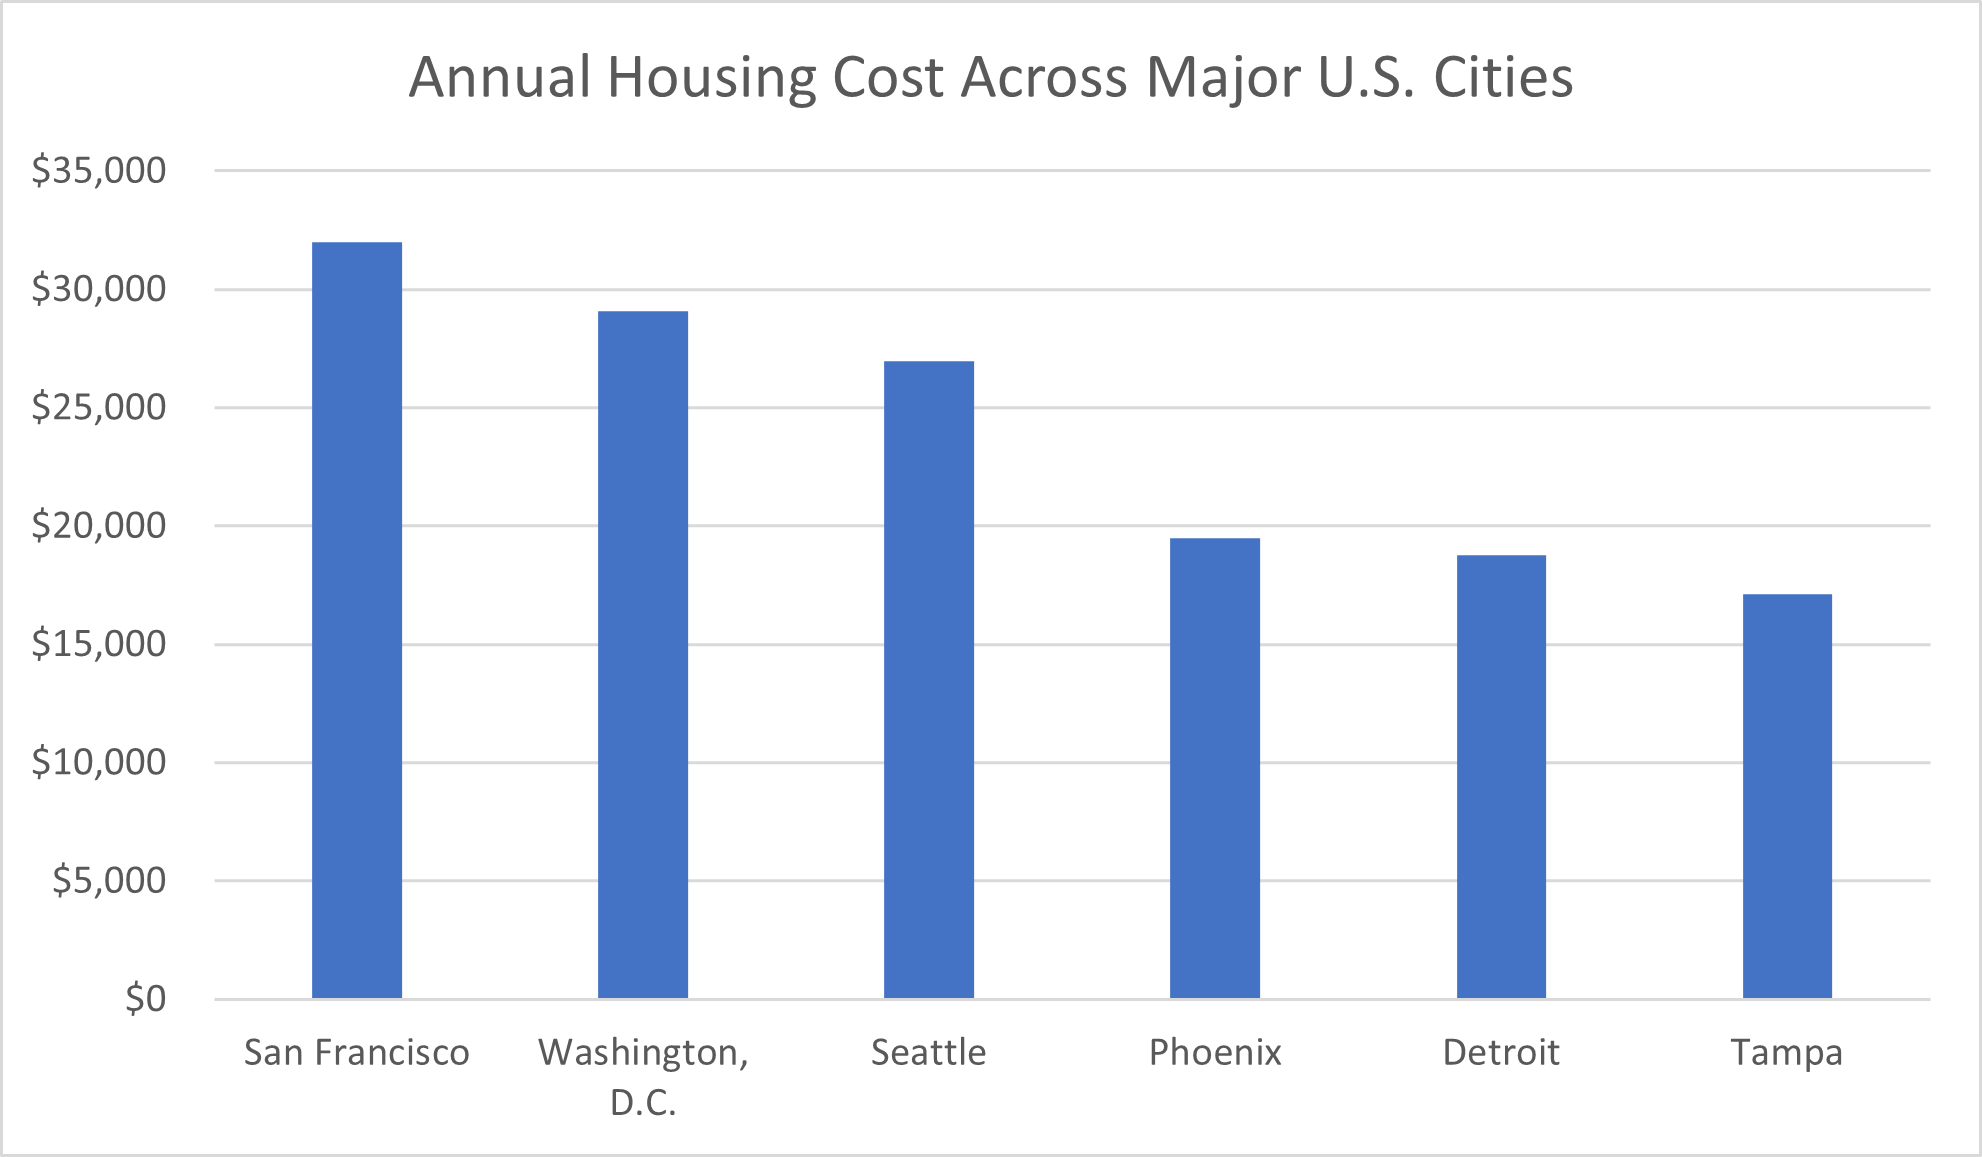
For instance, this cost is as high as $26,965 per year in Seattle, $29,101 per year in Washington D.C. and, at the top of the pack, San Francisco, where the average resident pays in excess of $32,000 for housing per year. This contrasts the cost for housing in major cities like Phoenix ($19,491 per year), Detroit ($18,794 per year) and Tampa ($17,131 per year).
In other words, the cost of housing in Washington DC is nearly twice what you might spend for a similar space in Tampa.
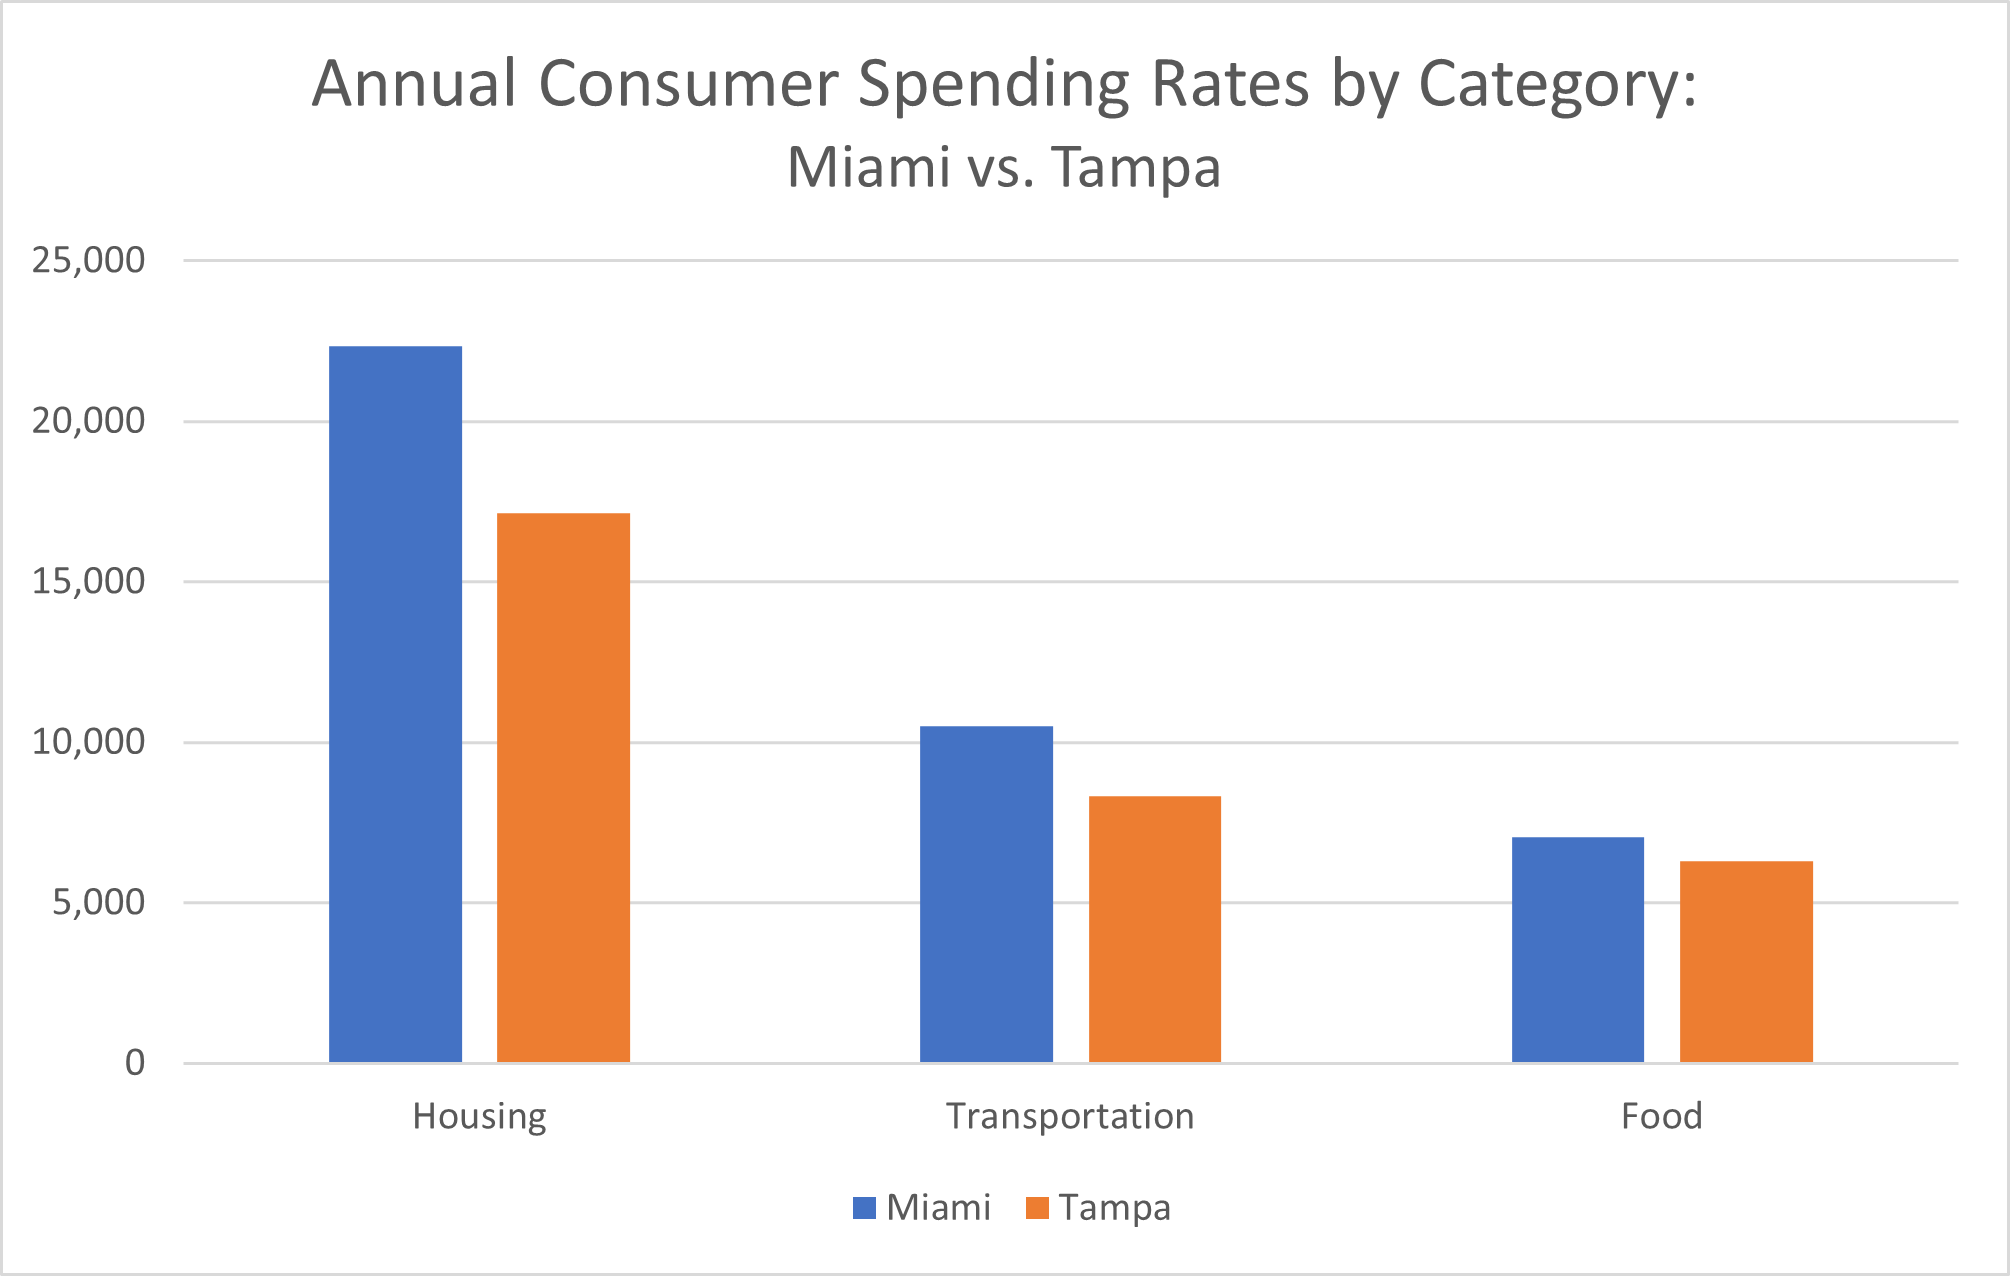
Speaking of Tampa, this South Florida city is roughly 280 miles away from another South Florida Metro area—Miami. According to Insider, housing in Miami notched a mark of $22,350 per year, denoting a more than 20% premium on the cost of living relative to Tampa.
Similar proportions separate the two cities over the cost of transportation ($10,507 vs. $8,307 in Tampa), whereas the difference in the cost of food ($7,040 in Miami vs. $6,289 in Tampa) is less extreme.
Evidence suggests that food costs are often fairly comparable from one major city to the next, whereas transportation is highly variable. It is entirely possible that this variation has more to do with how effectively each city has invested in public and mass transit than with the scale of economy in a given city.
In other words, the cost of housing would appear to be a far better indicator of the economic scale in each major metropolitan area.
The Connection Between Job Opportunities and Housing Costs
The highest ranking cities on this list in terms of housing cost are also generally those with the most robust local economies, the highest salary ranges for local workers, and the widest range of gainful employment opportunities.
Such is to say that the cost of housing in a city may be a strong indicator of what consumers are willing and able to spend to live in more desirable metro areas.
COVID-19 and American Spending Habits 2020
Bear in mind that the data highlighted above—both in terms of percentage of spending in different areas, and in terms of cost per city—all predate the COVID-19 pandemic. Dramatic shifts in spending during the last two years have altered the short-term landscape for consumer spending.
However, it isn’t clear that any of these changes will constitute long-term shifts in how Americans spend their money. That is an assessment that I can only make with the benefit of several more years hindsight. Until then, I can only evaluate the direct and immediate impact made by the pandemic on consumer spending habits.
To this end, the Bureau of Labor Statistics provided a New Release from September of 2021 highlighting some of the most readily observable changes in consumer spending following the emergence of the pandemic and its manifold impacts on businesses, consumers, and lifestyle choices throughout 2020.
Evidence suggests the biggest impact on consumer spending was felt in specific areas of discretionary income spending connected to recreation and entertainment outside of the home. Here, the BLS points to the direct shifts in consumer spending between 2019 and 2020 “for all units.”
Units are “classified by income before taxes by quintile, decile, and range; age of the reference person; size of the consumer unit; composition of the consumer unit; number of earners; housing tenure (homeowner or renter) and type of area (urban or rural); region of residence; occupation; highest education level of any consumer unit member; race; Hispanic or Latino origin; and generation of the reference person.”
Across all units, reports the BLS, consumer spending in 2020 came in at $61,334. This denotes a 2.7% decrease from the prior year. This decline in spending wasn’t simply an across-the-board decline. To the contrary, it reflected declines in certain areas specifically connected to business closures, lockdowns, and quarantines as a consequence of the pandemic.
For instance, spending on apparel and related services was down a staggering 23.8% over a single year, especially among men and boys. This was driven by a sharp downturn in brick-and-mortar shopping for items like footwear and sports apparel.
For further confirmation that consumer spending in select areas was crippled by the pandemic, note that while retail alcohol sales for in-home consumption rose by 4.5%, spending on alcoholic beverages outside of the home was down a dramatic 43.9%
Also down, says the BLS, was spending on food outside of the home, which declined by 32.6%; transportation, which saw an especially sharp drop off of 66.3% in the area of public transportation alongside a 25.1% fall in spending on fuel; and entertainment outside of the home, which saw ticket and admissions sales fall by a devastating 51.7%.

Areas that saw increases in consumer spending include mortgages and expenditures relating to home ownership, the latter of which spiked by 9.9% on the strength of various elective home renovation projects; cash contributions such as child support payments, contributions to religious groups, charitable donations, or political funding, which collectively jumped by 14.4%; and spending on in-home entertainment options including hobbies and toys (up 21.4%) and entertainment equipment (up 48.8%).
The takeaway from these BLS figures is that consumer spending generally declined, but more importantly, the focus of discretionary consumer spending shifted to a greater emphasis on in-home items and experiences.
As a result, the sharpest declines were felt in the sectors catering most to out-of-house experiences. At the same time, some of this economic impact was offset by added spending for in-home expenses.
Post-Lockdown Consumer Spending
While 2020 saw shifts in consumer spending habits, there is no evidence to suggest that these changes will be permanent. Once again, only the next several years will tell us the precise trajectory of consumer spending habits.
However, I have sufficient proof in just the last year that certain spending habits will likely return to pre-2020 levels as more time passes following the first phase of the pandemic.
The subsequent phase of the pandemic has been marked by the widespread proliferation of COVID-19 vaccines alongside an array of public health and safety strategies aimed at management of viral spread, in lieu of lockdowns and shutdowns.
These steps have resulted in a broad-based reopening of the economy—and in particular, of recreational and consumer opportunities outside of the home.
American Spending Habits 2021
With restaurants reopening, bands going back on tour, Broadway shows resuming their runs, theaters once again screening films, and sports teams inviting fans back into their stadiums, 2021 is seeing a major rebound of outbound consumer spending.
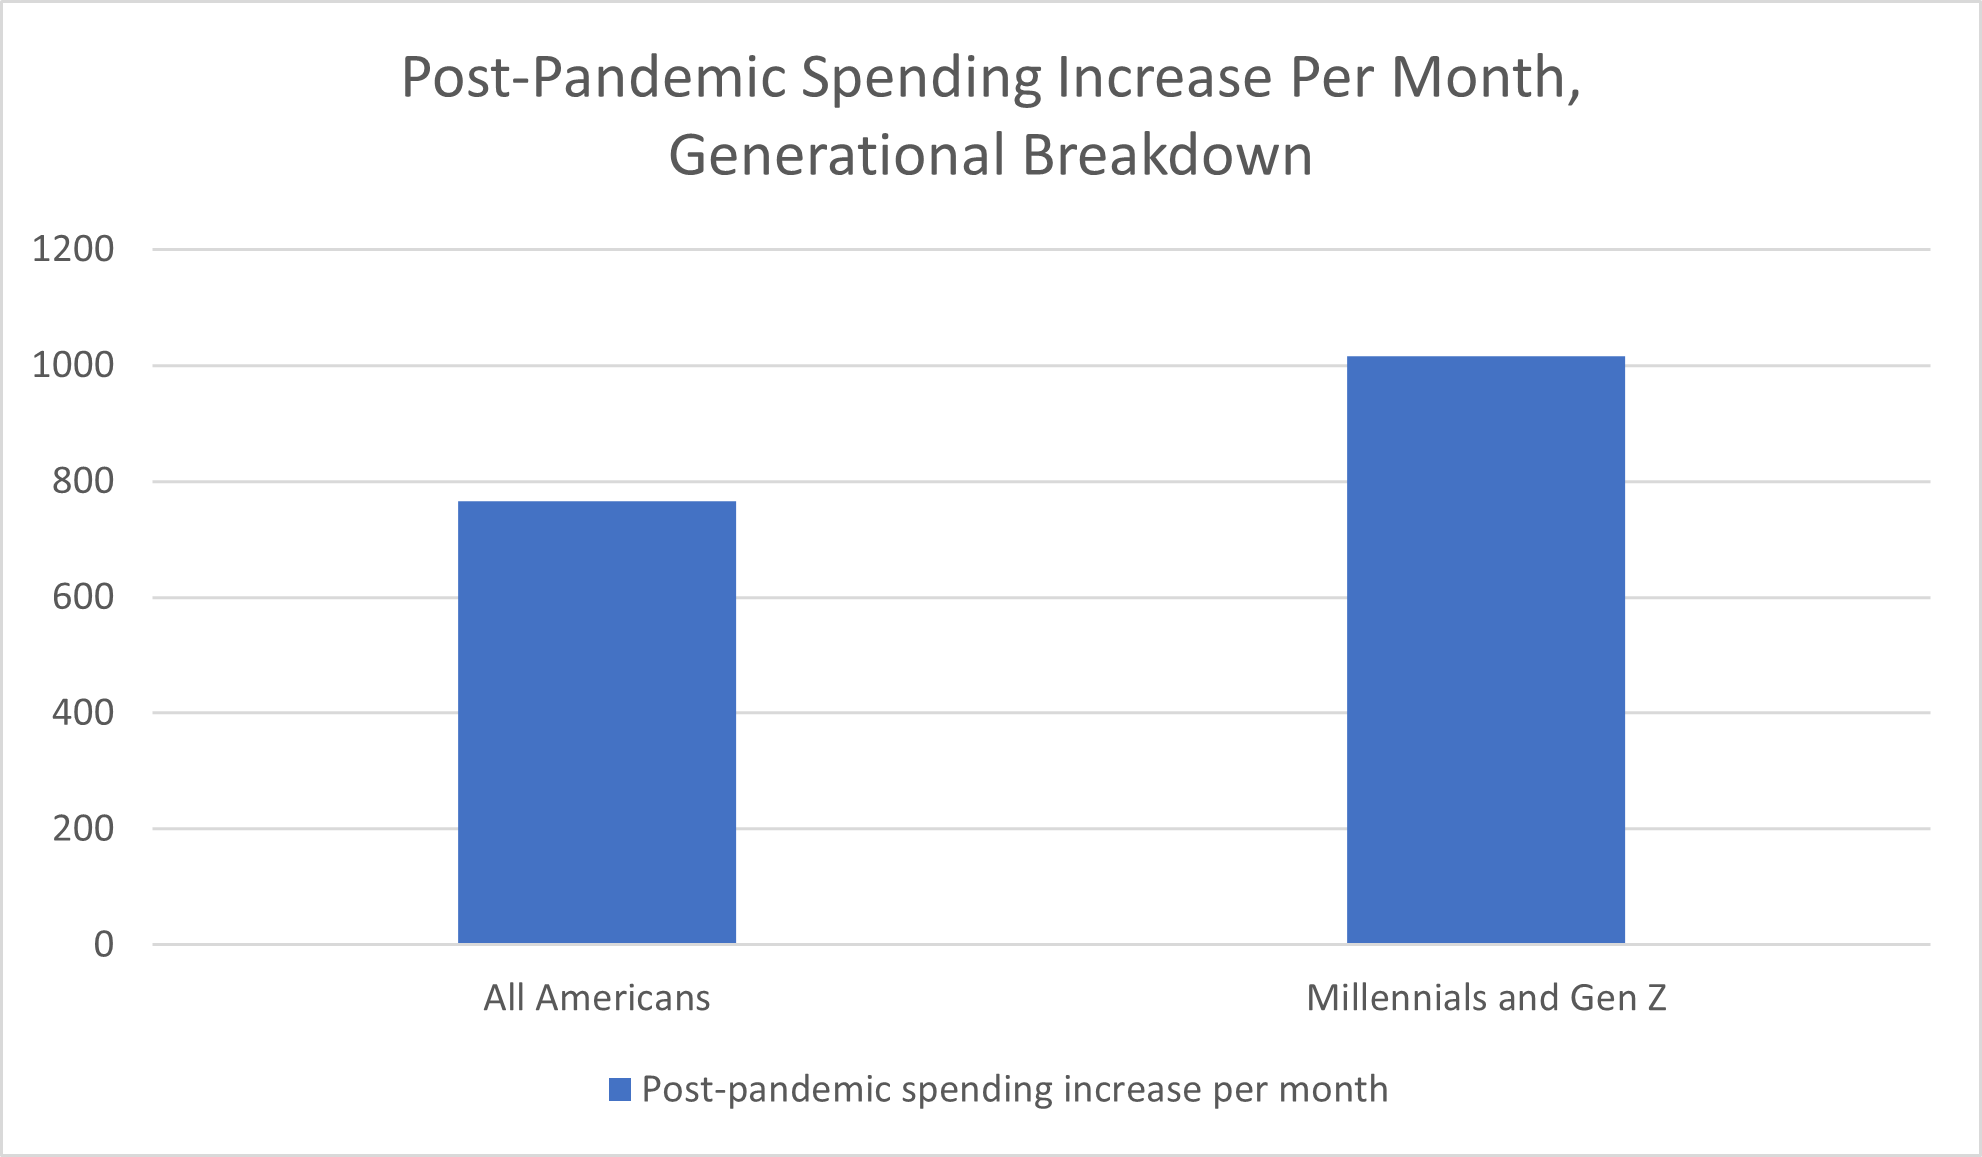
CNBC reports that “Between dining out and taking trips, Americans are now spending an average of $765 more a month compared with last year when much of the country was shut down due to the coronavirus pandemic, according to the MassMutual Consumer Spending & Saving Index.”
Spending habits vary depending on several factors, with age and income level being among the most important. This pattern holds true for post-pandemic economic recovery, as well.
Younger age groups, in particular, seem determined to return the American consumer economy to its former heights of glory, spending on recreational opportunities outside of the home with a newfound ferocity, according to CNBC.
Millennials and Gen Z, apparently making up for time lost during the pandemic, were spending $1,016 more per month in the summer of 2021 as compared to the prior year.
And yet, even in the face of these promising figures, new variants of the COVID-19 virus—like Delta and Omicron—have already left their mark on consumer spending. As with the pandemic in general, there remains so much about consumer spending in this era that remains uncertain.
How we weather the next several stages of life in the COVID era will likely have a direct bearing on how and where Americans spend their money.
American Spending Habits 2022 Update
Like the years that preceded it, 2022 brought plenty of stress and challenges for consumers. Pandemic-related lockdowns were over, but high inflation rates—and high costs in general across major spending categories—characterized the economy.
McKinsey & Company reported in May that 2022 consumer spending habits thus far had represented both a departure from pandemic restrictions and longer-term adaptations to Covid-era practices—for example, after years of lockdowns and social distancing, consumers were starting to make their way back to in-person shopping but still relied heavily on online shopping.
In June, Forbes forecasted that Americans would “keep spending in 2022” and into 2023, with consumer spending cutbacks predicted to fall closer to 2024. An August 2022 NPR article on inflation noted not only consumers’ spending concerns but also businesses’ efforts to offer affordable options despite the rising inflation rate.
Deloitte’s State of the Consumer Tracker reported in November that concerns over high costs, rising inflation, and personal savings levels had led to three consecutive months of Americans planning to spend less money in the coming month.