
The United States spends a jaw-dropping amount—multiple trillions of dollars per year—on health care, yet the data suggests that we aren’t getting our money’s worth. How does the quality and cost of the U.S. health care system compare to other countries like France, Germany, the United Kingdom, and beyond?
Health Care Spending in the U.S. vs. Other Countries
It’s no secret that health care in the United States is expensive. Between the monthly premiums you pay for health insurance and the inflated costs of actual health care services, many Americans are spending thousands of dollars per year on health.
Let’s explore different measures of international comparisons of the financial cost of health care.
Health Spending Per Capita Among Wealthy Countries
One of the best ways to gauge how the cost of health care in America compares to that of other countries that have different population sizes is by looking at the per capita health expenditures among comparable countries.
As a January 2023 CNN Health article reported, the United States spends $11,912 per capita on health care. The United States didn’t just top the list of per capita health spending. It beat out the country with the second-leading per capita expenditure by more than 60%.
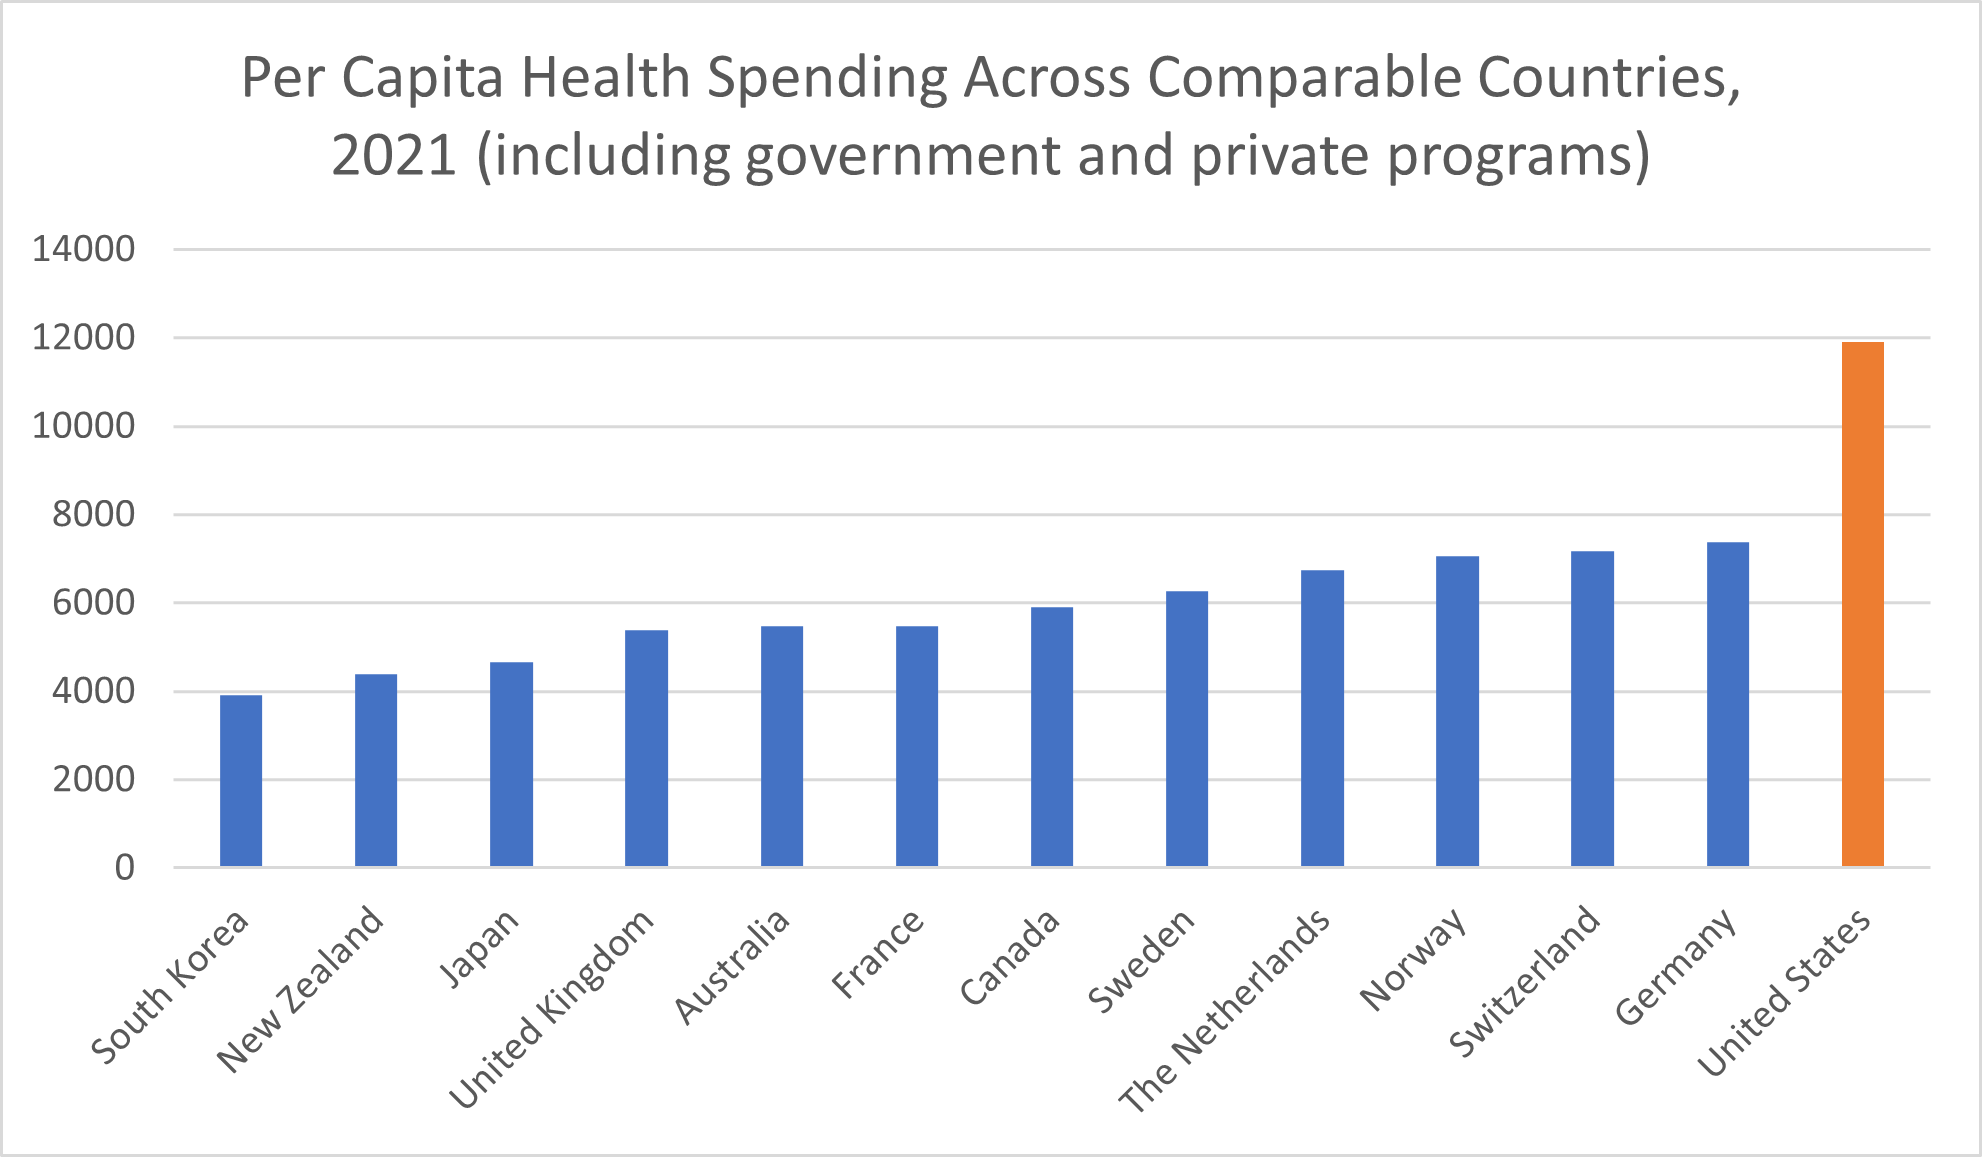
The next-closest high-income country is Germany, whose $7,382 per capita expenditure amounts to $4,500 less per person per year. In Switzerland, per capita health spending amounted to $7,179. Norway was the only other high-income country with a per capita health expenditure above $7,000, at $7,065. Sweden spent $6,262 per capita on its health care system.
The remaining seven high-income countries spend less than half of what the United States spends per capita on their health care systems. In Canada, per-person health spending amounted to $5,905. France spent $5,469 per capita on health, with Australia trailing just behind at $5,463. In the United Kingdom, health costs amounted to $5,388 per person.
Per the January 2023 issue brief “U.S. Health Care from a Global Perspective, 2022: Accelerating Spending, Worsening Outcomes” published by The Commonwealth Fund, the United States pays more than 2.5 times the health spending amounts of the final three nations chosen as comparable countries. Japan spent $4,666 on health care in 2021, followed by New Zealand’s $4,393 health expenditure. The peer country that spent the least per capita, South Korea, spent $3,914 on health care in 2021—less than one-third of what the United States spends on its health care system.
Keep in mind that this health care spending per person amount includes not only out-of-pocket spending but also health care spending through “government and private programs”—e.g., private and public health insurance organizations.
How U.S. Health Expenditures as Proportion of GDP Compare to Other Countries
The United States also spends a greater proportion of its overall wealth on the health care system. United States health care spending amounted to almost 18% of the nation’s GDP, according to The Commonwealth Fund.
In comparison, most of the 13 high-income countries included in THe Commonwealth Fund report spent between 10% and 12% or so of their GDP on health care. New Zealand spent just 9.7% of its total wealth on health care. Norway spent 10.1% of its GDP, and Australia, 10.6%.
The 11% range included the wealthy countries of Japan (11.1%), Sweden (11.4%), Canada (11.7%), Switzerland (11.8%), and the United Kingdom (11.9%). Germany is, again, the peer country with which we have the closest health care spending percentage, at 12.8% of its GDP. France also spends upwards of 12% of its gross domestic product on health care—12.4%, to be exact.
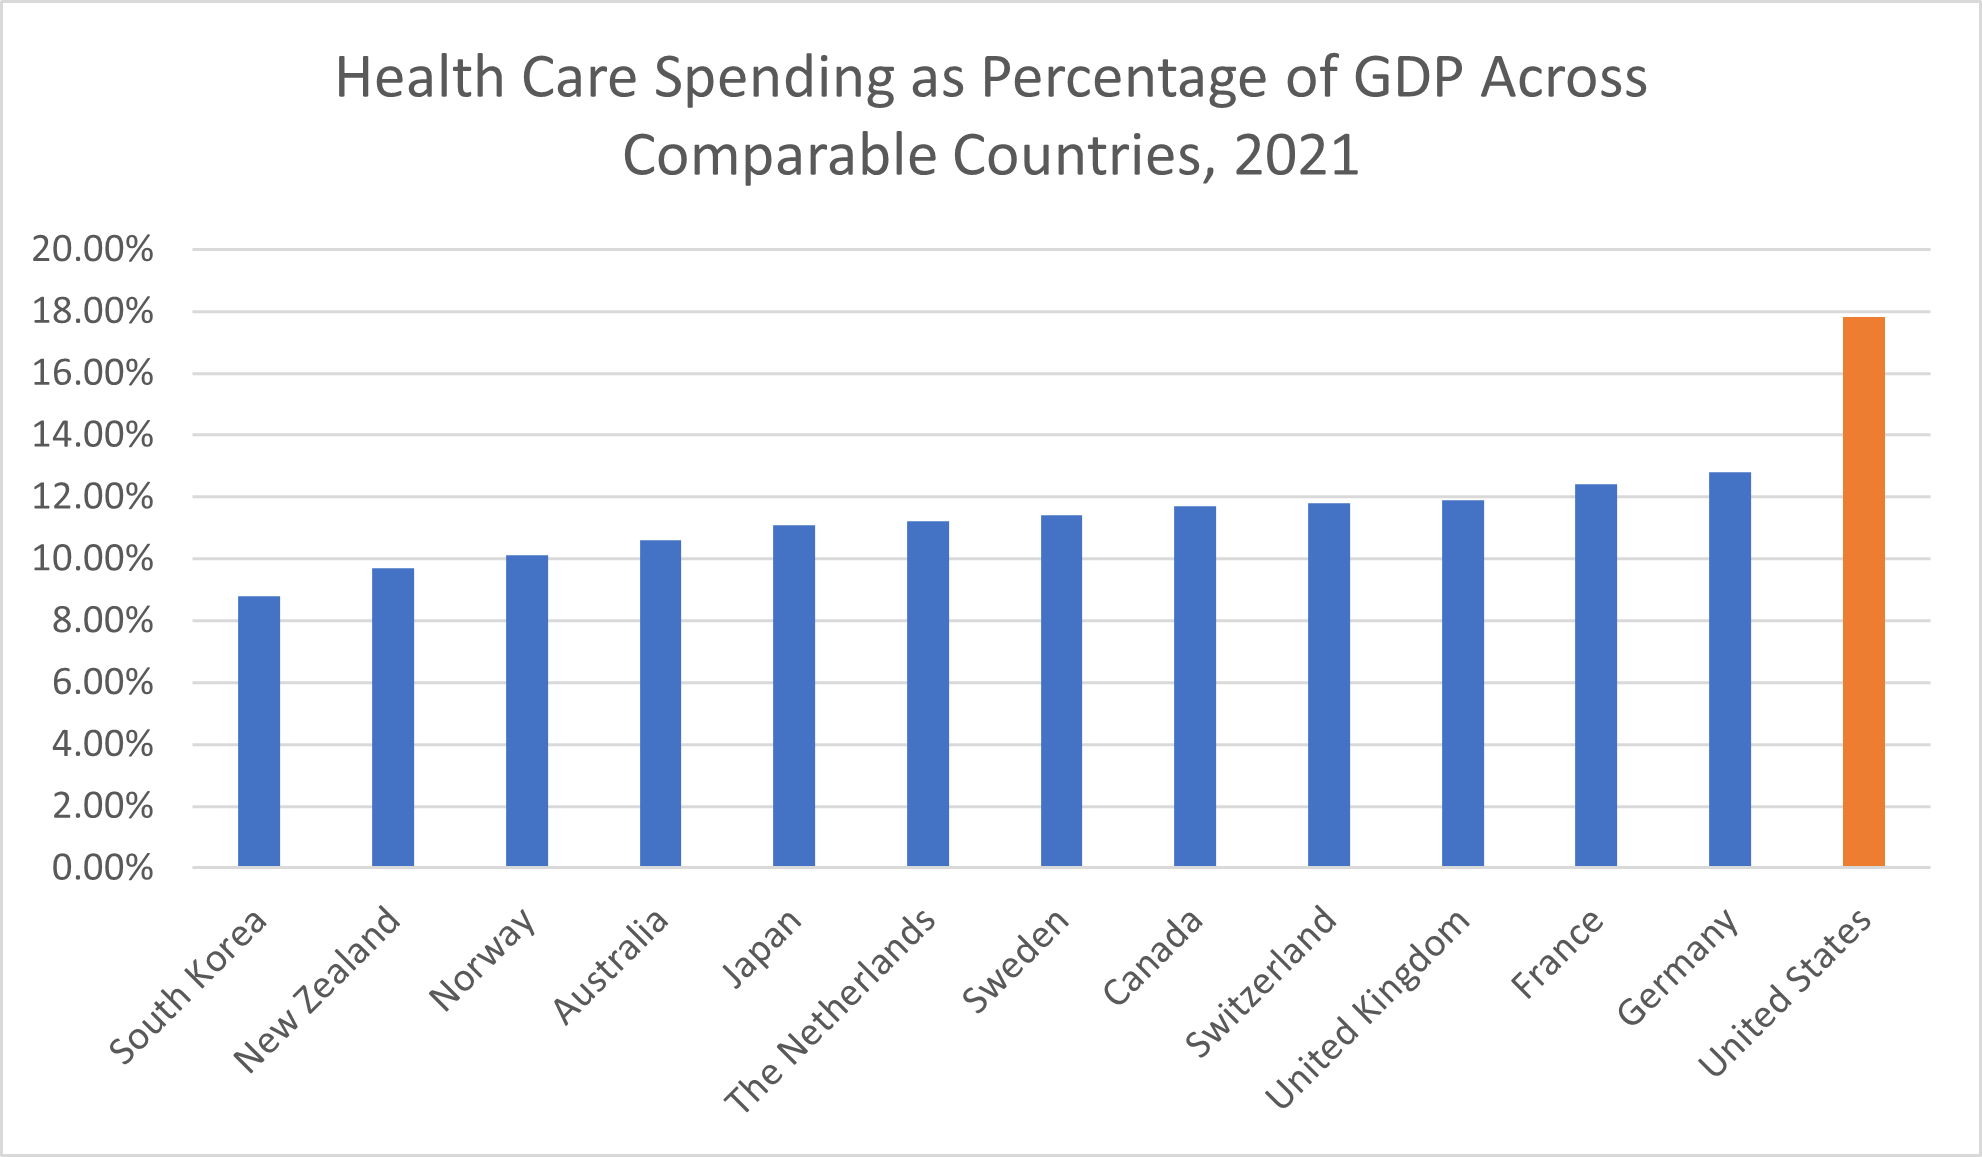
Even among our peer countries with the closest percentages to us, the United States spends nearly 1.5 times as large a proportion of its income on the health sector. Compared to South Korea’s 8.8% spending rate, the United States spends over twice as much.
By either measure of spending on health care costs, the United States is an “outlier,” The Commonwealth Fund noted. This means that the U.S. isn’t only the country that happens to spend the most—because, after all, one of these peer nations must be in the lead in terms of spending on health care. Rather, the United States spends so much more on health care than other high-income countries that it constitutes a statistical abnormality.
Health care, especially care that utilizes the latest medical technologies, is expensive—but only in the United States is it so expensive.
The Impact of Universal Health Coverage on Spending in the Health Sector
It’s worth noting that the U.S. health system is also the only one of the health systems included in this international comparison without universal health care coverage.
Universal health coverage itself is expensive. Even some of the politicians pushing for it have acknowledged that taxes on middle-income Americans would have to go up to finance such an effort—although if universal health coverage were implemented, Americans would see the thousands of dollars per year they’re already paying in health insurance premiums drop drastically, if not disappear altogether.
Despite the costs associated with a single-payer health system, not having universal health coverage clearly isn’t allowing Americans to pay less for health care than comparable countries with such health care systems. The measures of national health care costs used above—per capita and as a percentage of each country’s GDP—encompass both individuals’ out-of-pocket spending and expenditures by private and government programs, CNN reported.
Out-of-Pocket Health Costs in the U.S. and Comparable Countries
Suppose we remove government and private programs’ expenditures from the equation. If you look at out-of-pocket costs exclusively, the United States spends among the highest amounts once again: $1,305.10 in 2021, according to data from the PETERSON-KFF Health System Tracker. Only Switzerland spent more, with an average per capita out-of-pocket expense of $1,577.
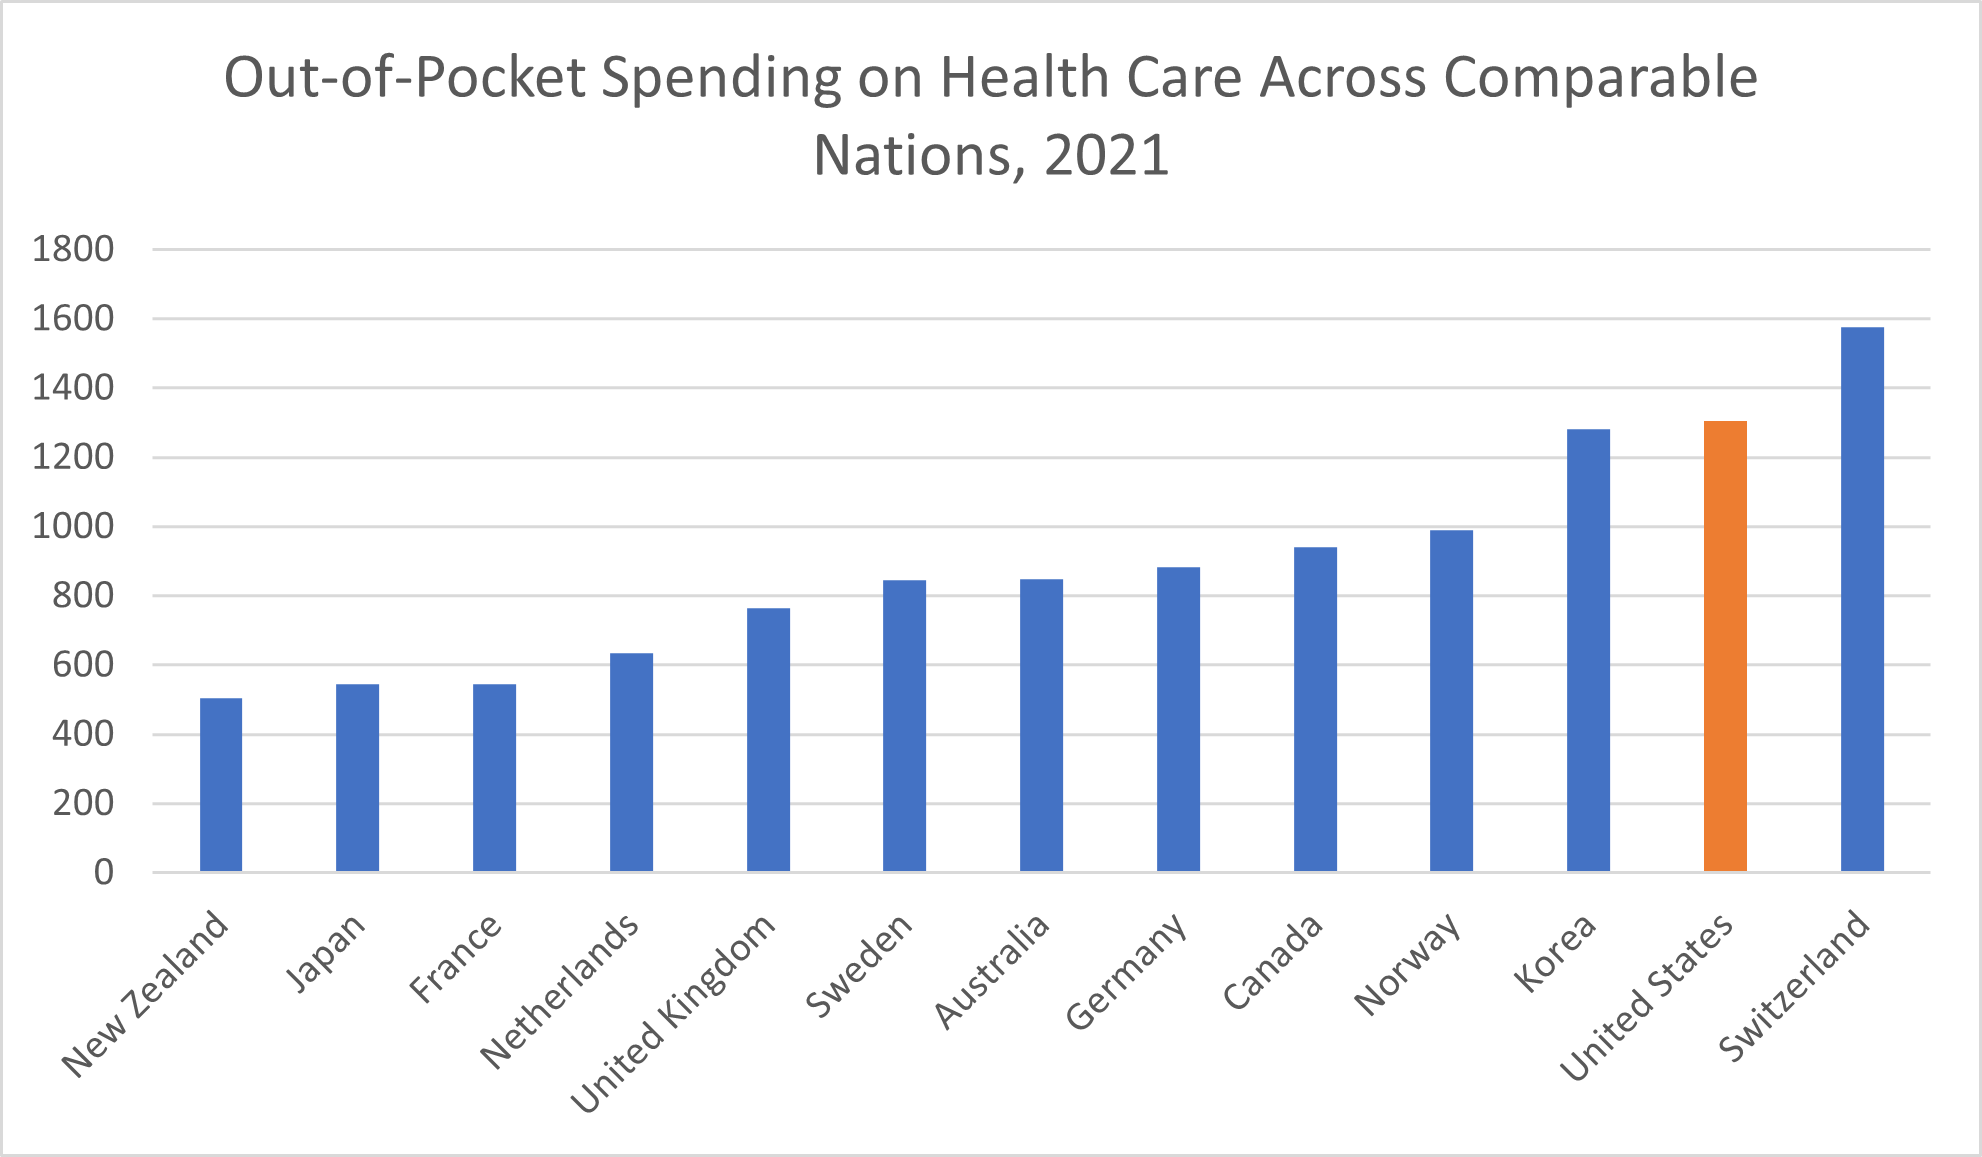
The U.S. spends nearly twice as much, or more than twice as much, in out-of-pocket health costs as the following high-income countries, according to the data from the international Organisation for Economic Cooperation and Development (OECD):
- New Zealand ($505.20)
- Japan ($544.50)
- France ($544.90)
- Netherlands ($634.40)
Where do other high-income country out-of-pocket health care costs fit in? Per capita, the average out-of-pocket cost in the United Kingdom was $763.90. In Sweden, the average out-of-pocket expenditure amounted to $845.60 in or around 2022, the Organisation for Economic Cooperation and Development reported. Australian households paid a similar average per capita amount, $848.90. The average out-of-pocket health care cost in Germany was $882.60.
In Canada, the average per capita out-of-pocket health expense was $940.60, according to the Organisation for Economic Co-operation and Development. Households in Norway paid $989.80 out of pocket, on average. With its $1,281.70 average, Korea joined the United States and Switzerland as the only three of these wealthy countries to report average out-of-pocket health costs above $1,000 per capita.
Pharmaceutical Drug Costs in the U.S. vs. Other Countries
Medications are a critical part of the health care system and a big part of health spending, especially in the United States—even though pharmaceutical drugs themselves remain a leading cause of death in America.
“Americans spend more on prescription drugs per capita than citizens in any other country,” the University of California reported in September 2022. The 2021 report “International Prescription Drug Price Comparisons” by the RAND Corporation, a research organization, found that drug prices in the U.S. are 2.56 times more, on average, compared to drug prices in 32 other countries. While the combination of government programs and private health insurance companies in the U.S. spent $963 per capita on prescription drugs in 2019, comparable countries spent an average of $466, the Peter G. Peterson Foundation reported.
The main culprit behind this massive difference in drug costs is brand-name drugs. The RAND Corporation reported that the U.S. spends an average of 3.44 times what other nations do on name-brand drugs. When it comes to generic drugs, which make up 84% of prescription drugs sold in the United States, prices are slightly lower than average compared to other countries. Unfortunately, the brand-name medications that make up the other 16% of pharmaceutical drugs sold in America also account for approximately 88% of drug spending because of how expensive they are.
For some of the most expensive name-brand drugs, like medications that treat cystic fibrosis, autoimmune diseases, and hepatitis C, the U.S. price per capita amounted to $1,500, $2,000, or even $8,000 more than the average comparable country, the Peter G. Peterson Foundation reported.
Red Herrings in U.S. Pharmaceutical Costs
Why does the U.S. spend so much more money on prescription drugs? The reason isn’t purely because Americans take more medicines than citizens of other countries. While the percentage of Americans who regularly take prescription medicines is among the highest of comparable countries at 58%, that represents only a marginal increase from the 51% average for all comparable countries, the Peterson-KFF Health System Tracker showed. This difference may account for a small share of the increased spending on prescription drugs but certainly doesn’t explain the entirety of the large distinction between what the U.S. spends on pharmaceuticals and what other countries spend.
These higher costs also aren’t strictly related to research and development expenses, as the pharmaceutical industry would like consumers to believe, the University of California reported. When researchers compared costs of research and development with drug prices for 60 medications, they failed to see an association between either research and development costs or therapeutic value and the price of the drug.
Bypassing the Free Market, Removing Price Competition
The more fitting explanation of why drug costs are so much higher in the U.S. is because, in our health care system, we have neither a truly free market nor government-negotiated drug prices. The consequence is that, for these blockbuster name-brand drugs, there’s no effective mechanism to keep prices down.
In a truly free market, companies would compete against each other in ways that can help keep costs low. If one company insists on charging an outrageous price for a medication that’s chemically the same as another, the patient could choose to switch to a different manufacturer with a more affordable price.
“The problem with drug prices – especially for the coming wave of innovative cures and personalized, precision medicines – is not that they start out expensive, but that they stay expensive for years after they have been on the market,” physician Tom Coburn wrote in an opinion article published in U.S. News & World Report in 2018. “The main culprit here is the regulatory environment that limits the creation of a free, functioning and competitive market for prescription drugs,” Coburn elaborated.
In the U.S., the development of new drugs uses a patent system. Allowing drugmakers to patent their products and reap the full financial benefits of the new drug for a considerable length of time (often five to 10 years after the medication is approved for the market) incentivizes innovation. Why would a pharmaceutical company undertake a decade or more of expensive drug development and clinical testing if its competitors were immediately allowed to steal the formulation and profit off of it? Unfortunately, the unintended consequence of patenting new drugs means that there is no such free market in the U.S. pharmaceutical industry that could keep prices down.
If there’s no free market to force price competition, giving the government the authority to negotiate prices can offer a backup plan for keeping medications from ascending to unaffordable price points. In many countries, the government has the authority to regulate or negotiate drug prices. In the United States, no such regulations exist, so drug companies can charge what they want.
“The U.S. doesn’t negotiate prices with pharmaceutical manufacturers like other countries do,” GoodRx reported in an article updated in October 2022, noting that the same law that created the Medicare Part D prescription drug benefit in 2003 prohibited such negotiations.
How a Huge Obamacare Concession Gave Drug Companies Free Reign to Rake in Record Profits
Of course, between 2003 and today, one of the most extensive and comprehensive health reform laws in U.S. history was passed: the Affordable Care Act of 2010, better known as Obamacare. Despite the widespread changes in the health and insurance industries Obamacare implemented, this health reform bill neglected to give the federal government any authority to negotiate prescription drug costs.
“The ACA did not grant the Department of Health and Human Services (HHS) the right to negotiate the prices of prescription drugs with pharmaceutical companies on behalf of public payers,” a 2020 Health Affairs article reported.
This omission was no mere oversight but rather a calculated compromise made to get the powerful pharmaceutical industry on board with the sweeping changes Obamacare intended to make to the U.S. health system. “This accord ensured the industry would use its formidable lobbying clout to pass Obamacare—not destroy it,” a 2015 article by progressive investigative news organization Mother Jones explained.
“To ensure that pharmaceutical companies would be on board with the law when it was being negotiated, a range of policies that were initially discussed, did not make the final cut,” a Boston University article noted. Since the law’s passage, the role of the pharmaceutical industry in its final provisions has been criticized, as emphasized by the publication of a 2012 article alleging that “Obama was pushed by drug industry” in The New York Times.
Former North Dakota Senator Kent Conrad, who served on the Finance Committee that was involved in the negotiations, said, “Probably my single greatest regret, is we didn’t have the chance to get negotiating power for Medicare for drugs,” business intelligence company Morning Consult reported in 2016.
Whether you regard such a strategy as selling out or merely making necessary concessions in a negotiation, it became a pivotal point in not only the passage of the historic health care reform law but also the progression of drug prices to increasingly unaffordable rates more than a decade later.
How did this happen? “The industry moved smartly and swiftly as Obamacare was taking shape,” a 2016 Politico article reported. In early negotiations with the White House and Senate Finance Committee Democrats, “the drug companies agreed to pay $90 billion to help fund the law’s insurance expansion — an expansion that would also happen to deliver millions of new, paying customers to the drug companies,” according to Politico.
More specifically, as the Health Affairs article referenced above explained, two Obamacare provisions “increased pharmaceutical companies’ direct responsibility for financing medical care in public programs.”
The Coverage Gap Discount Program would require pharmaceutical manufacturers that sold brand-name medications to provide discounts to Medicare beneficiaries whose total drug costs have reached a certain limit during the plan year. As of the Bipartisan Budget Act of 2018, Health Affairs reported, the responsibility pharmaceutical companies have to reduce the costs for these beneficiaries equated to 70%.
The second provision under which pharmaceutical manufacturers have a direct responsibility to finance medical care is the Branded Prescription Drug Fee. Drug companies that reported upwards of $5 million in sales of brand-name medications to Medicare, Medicaid, and other government programs have collectively paid between $2.5 billion and $4.1 billion per year (as of 2020) according to this provision, with the drugmakers paying in proportion to their share of drug sales to government programs. Through this provision, the federal government funds its Medicare Part B Trust Fund, which provides outpatient care benefits, Health Affairs reported.
Other Obamacare provisions put upon pharmaceutical manufacturers an indirect responsibility for funding pharmaceutical drug expenditures, Health Affairs reported. Through these provisions, the law required drugmakers to provide steeper rebates and expanded the drugs eligible for rebates under the Medicaid Drug Rebate Program and expanded eligibility for 340B discounts on pharmaceuticals to a wider array of hospitals and health care facilities.
Despite the considerable investment the pharmaceutical industry made as part of this agreement, it was a good deal for the drugmakers. Not only did the industry retain free rein to price drugs as it pleased (even when taxpayer dollars were paying for them), but the law essentially increased Big Pharma’s customer base. With more Americans insured and insurance companies obligated to pay for an expanded list of prescription drugs, the pharmaceutical industry could count on more consumers purchasing its products.
More than a decade later, the outcome of its negotiation with regard to the Obamacare law has been a boon for the pharmaceutical industry. As the 2020 article by Boston University noted, the current “skyrocketing costs are an unintended consequence of the way that the law came together.” In fact, the Peter G. Peterson Foundation reported that “brand-name drugs have experienced a swift increase in their cost over the last decade, aiding in the rise of per-capita spending.”
It’s no coincidence that, as OpenSecrets.org reported, political contributions from pharmaceutical manufacturers “soared following passage of the Affordable Care Act (aka “Obamacare”) in 2010 and have since “jumped in each presidential election cycle since 2012.” With the unaffordable costs of prescription drugs at the forefront of voters’ minds today, the pharmaceutical industry needs to retain some power if it wants future regulations to be as favorable to the industry as possible.
International Comparisons of Administrative Costs of Health Systems
Part of the high cost of the US health care system is its complexity, which is a direct result of how the combination of private health insurance and government health coverage fits into the U.S. health system. “The structure of health financing is more complex in the United States,” the Organisation for Economic Co-operation and Development reported. With that complexity comes higher costs of administration.
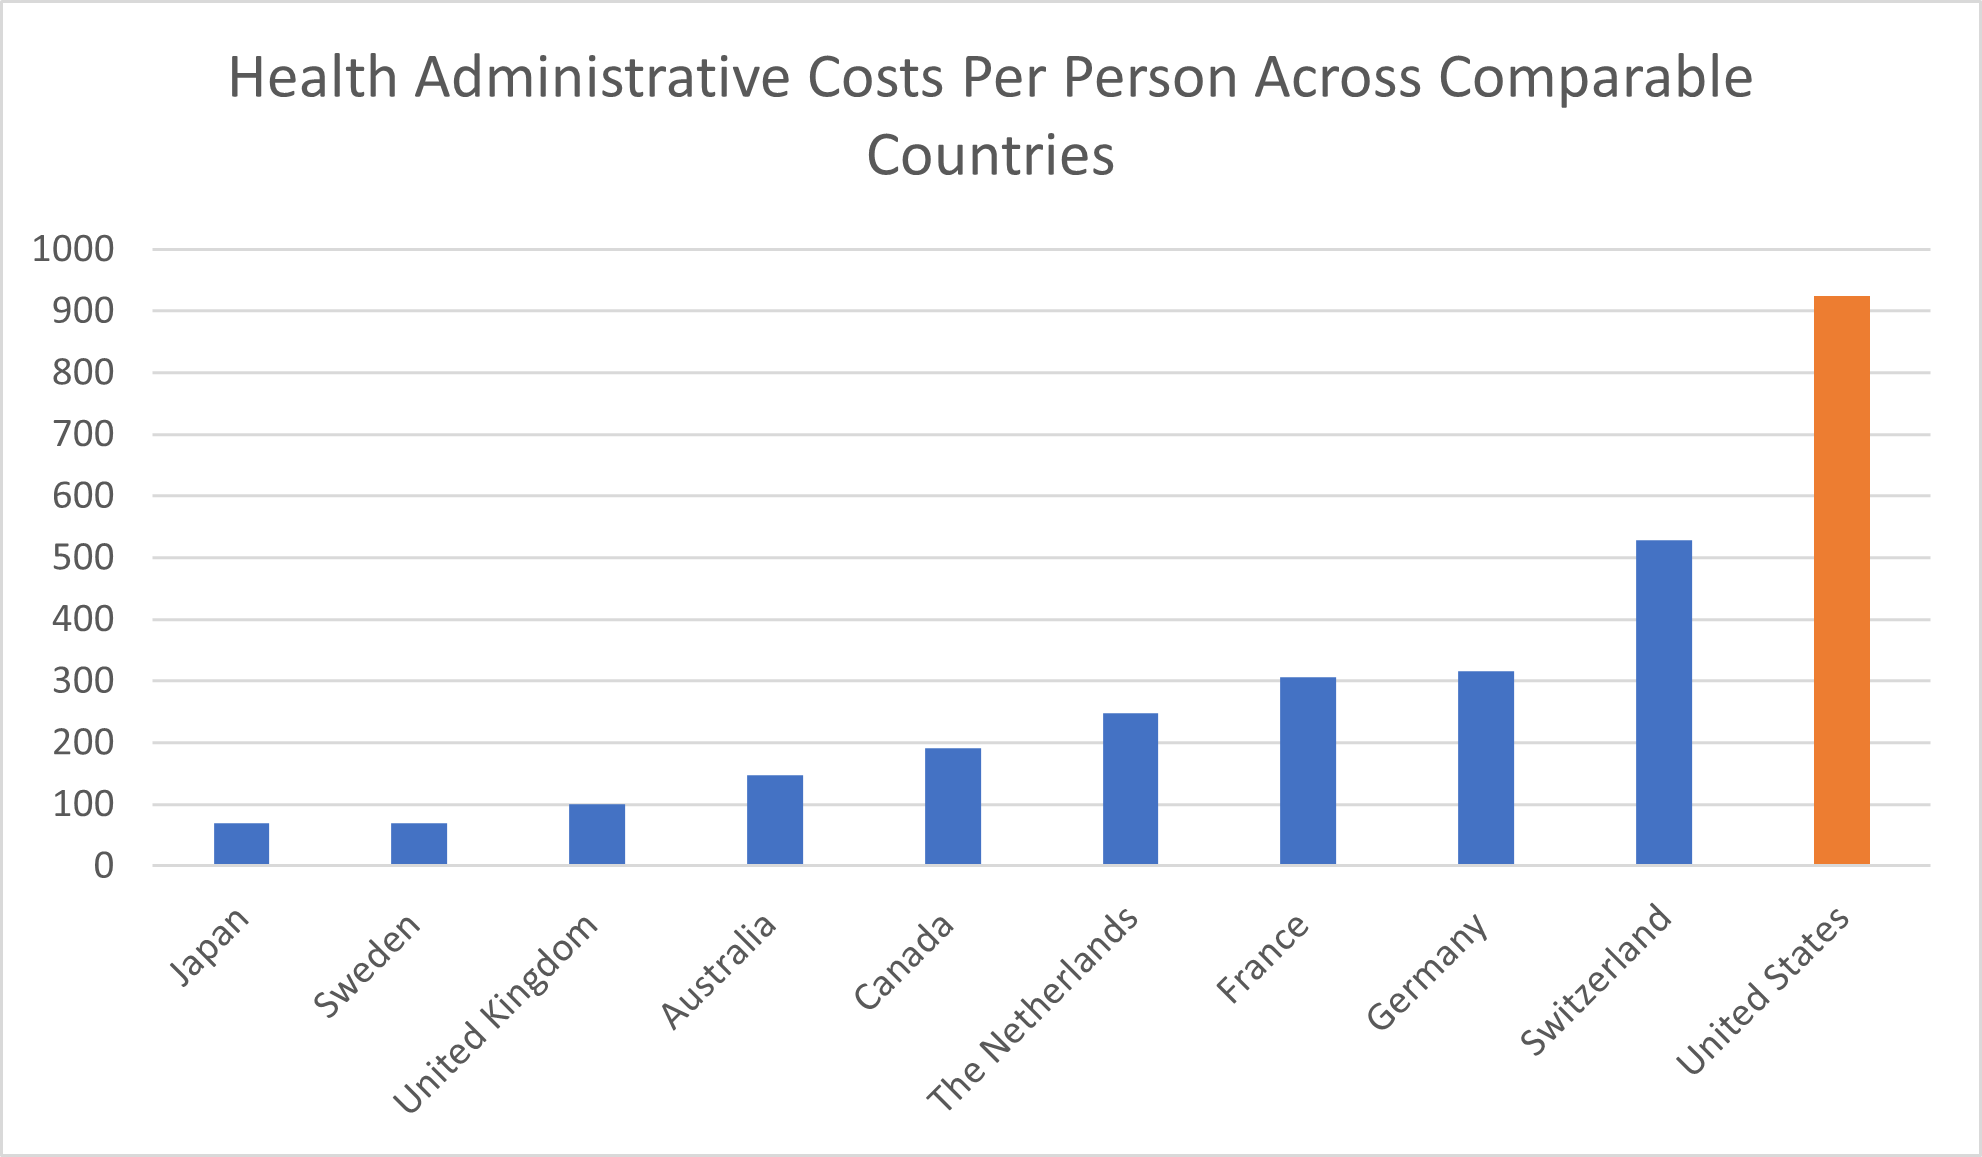
“The United States spends more on administrative costs… than other wealthy countries,” the Peter G. Peterson Foundation reported. The foundation bases this assertion on data that lists the per capita administrative cost in the U.S. as $925 per year. That’s more than four times the administrative cost of the average OECD country.
In comparison, Sweden and Japan both reported per-person administrative costs of just $70, the Peter G. Peterson Foundation reported. In the U.K., administrative costs per capita amounted to $100, and in Australia, they reached $148. Even compared to the other high-income country with the highest administrative cost, Switzerland ($528), the per capita administrative cost in America was nearly twice as much. Compared to Sweden and Japan’s $70 administrative cost, the cost of administering the U.S. health care system represents a 13-fold increase.
The Peter G. Peterson Foundation’s assertions are based on credible OECD Health Statistics 2023 and reflect the OECD findings that “the United States spends more on health than other countries, particularly on… administering the system.” These costs account for 8% of all health care spending in America and, by dollar amount, are five times the average administrative costs of America’s peer countries in the Group of Seven (G7).
The takeaway: the United States doesn’t only spend a lot of money on its health system. It also spends five times more than comparable countries on the administrative aspects of health care that don’t, in and of themselves, improve anyone’s health at all.
This reality leads us to a high-stakes question: What about health outcomes?
How Health Outcomes in the United States Health System Compare to Other High-Income Countries
Looking at health spending tells us a lot about the financial aspects of a health care system, but a critical piece of the puzzle is still missing. To truly understand the state of health care around the globe, we have to look at health outcomes, too. Health outcomes are even more important than health expenditures in understanding how successful different countries’ systems are at preserving and restoring their citizens’ health.
Americans may spend two or even three times what some other countries spend on health care, but if we as a nation were seeing equally unrivaled health outcomes, that spending may well be justified.
As it stands, though, the data illustrates that Americans aren’t getting better health outcomes from their outrageously expensive health care system compared to citizens of other wealthy countries. According to The Commonwealth Fund, people who live in the United States tend to die younger and are more likely to die from preventable causes compared to peer countries.
Life Expectancy Among Comparable Countries
Calculating the quality of health systems isn’t an exact science. The different aspects of a health system you could compare, along with the reality of inconsistent and imperfect metrics when you’re comparing data across different nations, make this effort more complicated. One of the simplest ways to assess the quality of a health system is by looking at the life expectancy across comparable countries.
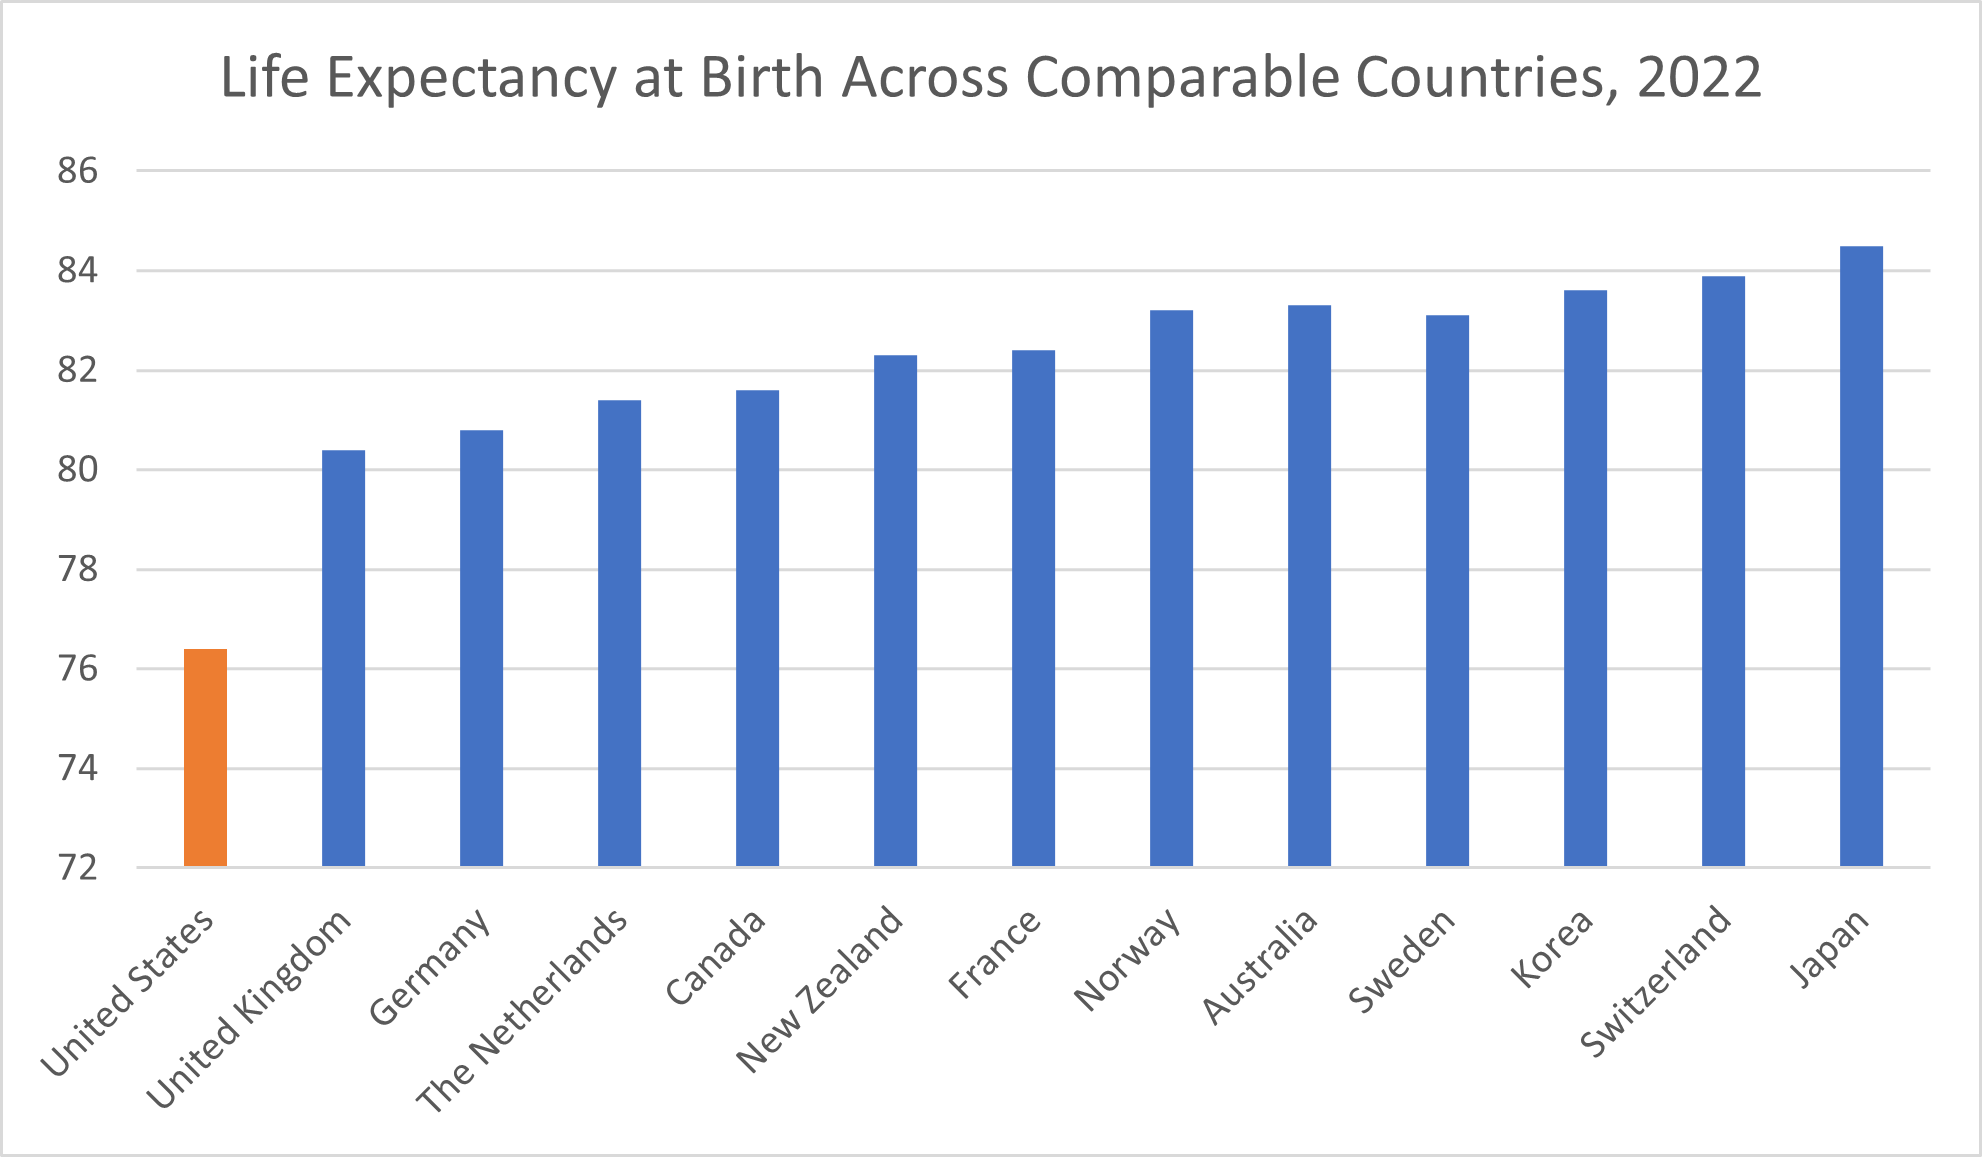
According to 2022 data from the Organisation for Economic Co-operation and Development, of the 13 comparable countries included in The Commonwealth Fund’s comparison, the U.S. reported the lowest life expectancy at birth: 76.40 years.
In the U.K., life expectancy at birth is 80.40 years as of 2022. Germany reported a life expectancy of 80.80. Life expectancy in the Netherlands is 81.40 years, while in Canada, it’s 81.60 years. New Zealand and France report a similar life expectancy at birth, at 82.30 years and 82.40 years, respectively. Sweden reported a life expectancy at birth of 83.10 years. Norway and Australia are also within one-tenth of a year of each other, reporting respective life expectancy at birth of 83.20 years and 83.30 years.
Despite spending the least per capita among these comparable countries, Korea reported an 83.60-year life expectancy that puts it in the top three of our comparable countries. In Switzerland, the life expectancy at birth is 83.90 years. Japan reported the highest life expectancy among the comparable countries, at 84.50 years.
Even compared to the peer country with the next lowest life expectancy at birth, the United Kingdom, Americans are looking at four years of life lost, on average. Compared to Japan, the number of years of life lost more than doubled to over eight years.
It’s worth noting that life expectancy dropped globally in the wake of the COVID-19 pandemic. Across 27 countries, life expectancy dropped by an average of 1.33 years at age 15 or 0.91 years at age 65 due to the impact of the COVID-19 pandemic, researchers wrote in a 2023 article published in the journal Scientific Reports. Still, how long the decline in life expectancy prompted by the COVID-19 pandemic lasts depends on where you are.
“While countries in western Europe experienced bounce backs from life expectancy losses of 2020, eastern Europe and the United States witnessed sustained and substantial life expectancy deficits,” the researchers behind the study concluded. The lingering effects of the COVID-19 pandemic on the United States life expectancy are unsurprising, given that “more people died from coronavirus infections in the US than in any other high-income country,” as CNN Health reported.
Avoidable Death Rates Across the Globe
What particularly paints the United States as having the worst health outcomes among comparable countries isn’t just its shorter life expectancy but also its higher rate of avoidable deaths. Avoidable deaths constitute deaths that can be prevented through healthy lifestyles (exercise and eating well), public health efforts and effective, timely medical intervention.
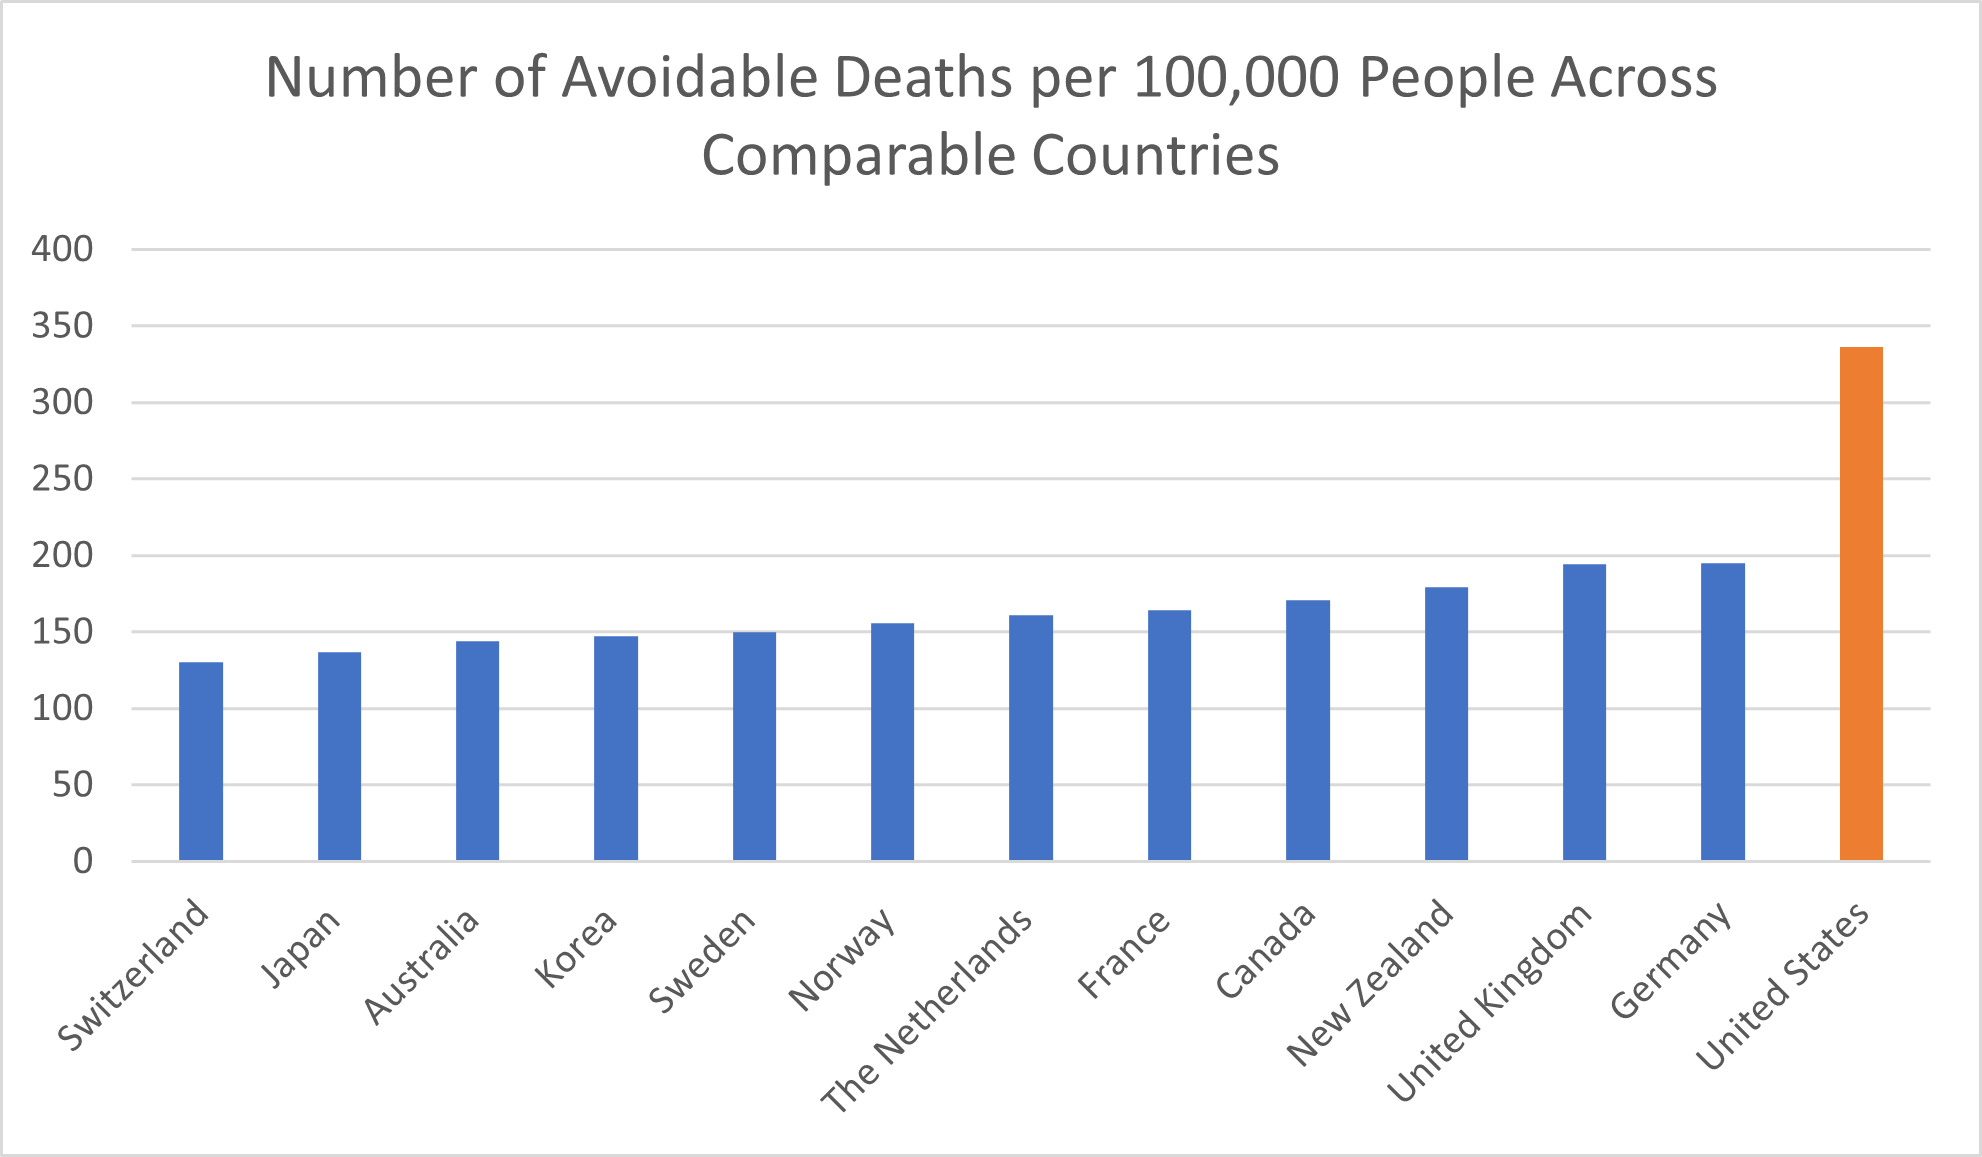
For every 100,000 people in the United States, the rate of avoidable deaths as of 2020 was 336, The Commonwealth Fund reported. That’s nearly twice the 171 avoidable deaths per 100,000 people in Canada and more than twice the avoidable deaths in another eight comparable countries:
- Switzerland (130)
- Japan (137)
- Australia (144)
- Korea (147)
- Sweden (150)
- Norway (156)
- Netherlands (161)
- France (164)
Even among the two peer countries with the closest avoidable death rates—the UK and Germany, with 194 and 195 deaths per 100,000 people, respectively—the rate of avoidable deaths in the U.S. represents an increase of more than 70%.
Prevalence of Chronic Conditions in the U.S. and Comparable Countries
Contributing to the shorter lifespans and more common avoidable deaths in the United States is its prevalence of chronic conditions.
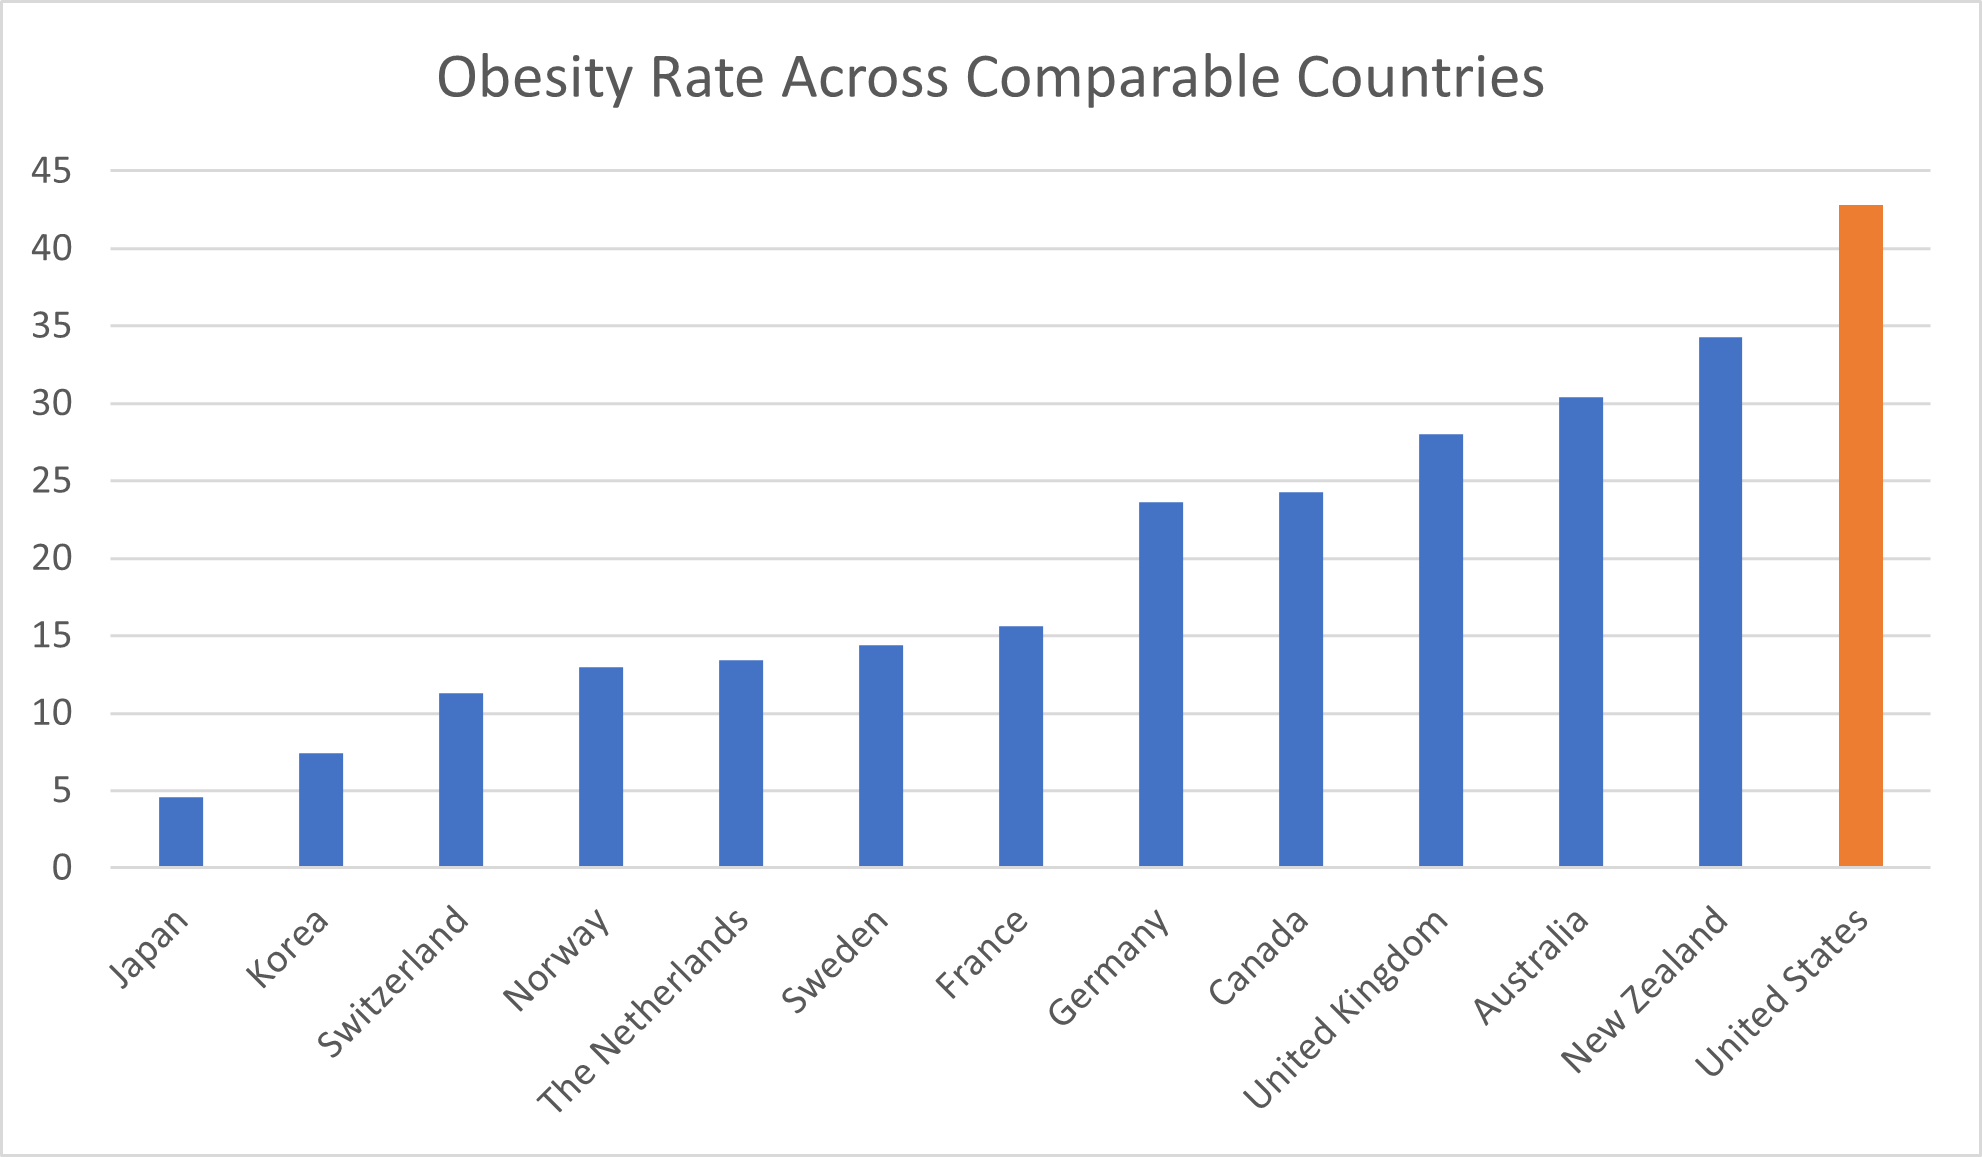
Let’s look at obesity first. The percentage of the total United States population that is characterized as obese is 42.8%. Both New Zealand and Australia reported obesity rates in the 30% range, at 34.3% and 30.4%, respectively. While 28% of the population in the U.K. are obese, 24.3% of Canadians and 23.6% of Germans are. In France, the obesity rate is 15.6%.
Several countries report obesity rates below 15%. In Sweden, 14.4% of the population is considered obese. The Netherlands reported an obesity rate of 13.4%. The obesity rate in Norway is 13.0%. In Switzerland, 11.3% of the population is characterized as obese.
Two comparable countries report obesity rates below 10%. In Korea, 7.4% of the population is obese. Only 4.6% of the population of Japan is obese.
The proportion of the United States population that is obese amounted to more than 2.5 times that of France and more than 3 times that of Norway and the Netherlands. Compared to Switzerland, the U.S. has nearly 4 times as high an obesity rate. The obesity rate in the United States is more than 5 times that of Korea and almost 10 times that of Japan.
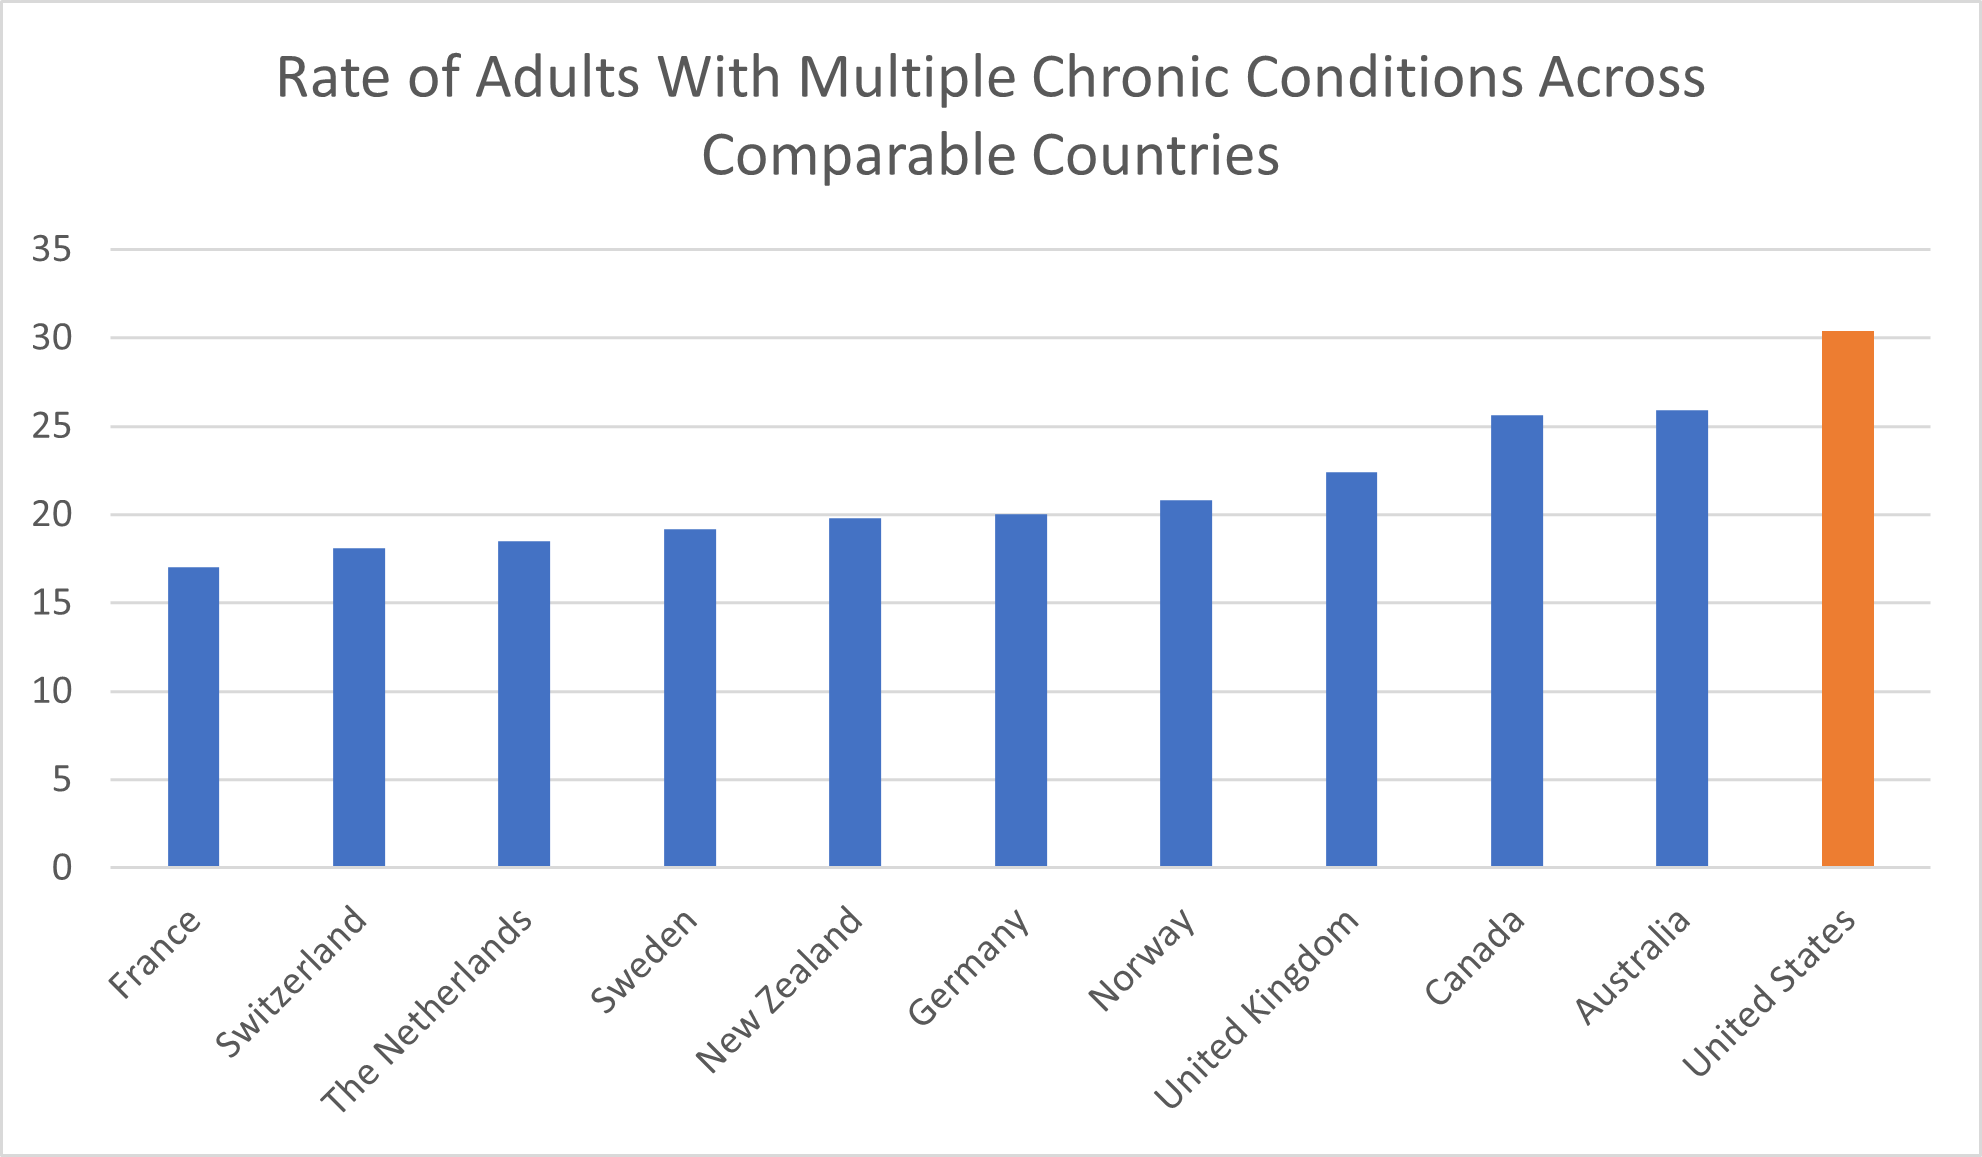
The U.S. isn’t only leading our peer countries in terms of obesity. We also have the highest rate of adults ages 18 and up who are living with multiple chronic conditions. Examples of such conditions are heart disease, diabetes, depression, asthma, and high blood pressure.
The 30.4% of adults with multiple chronic conditions in the United States represents an increase of more than 70% compared to France, where just 17% of the population has multiple chronic conditions. In Switzerland and the Netherlands, 18.1% and 18.5% of the population respectively reported having multiple chronic conditions. Among patients in Sweden and New Zealand, 19.2% and 19.8%, respectively, had multiple conditions.
A full 20% of Germans had multiple chronic conditions, as did 20.8% of Norwegians. In the U.K., 22.4% of adults had multiple chronic conditions. Even compared to the 25.6% of adults in Canada and 25.9% of adults in Australia who have multiple chronic conditions, the proportion of U.S. patients in this situation reflected an increase of nearly 20%.
Based on health statistics of obesity and multiple chronic conditions, people in the United States are less healthy than those in comparable countries.
Health Outcomes for Women and Children
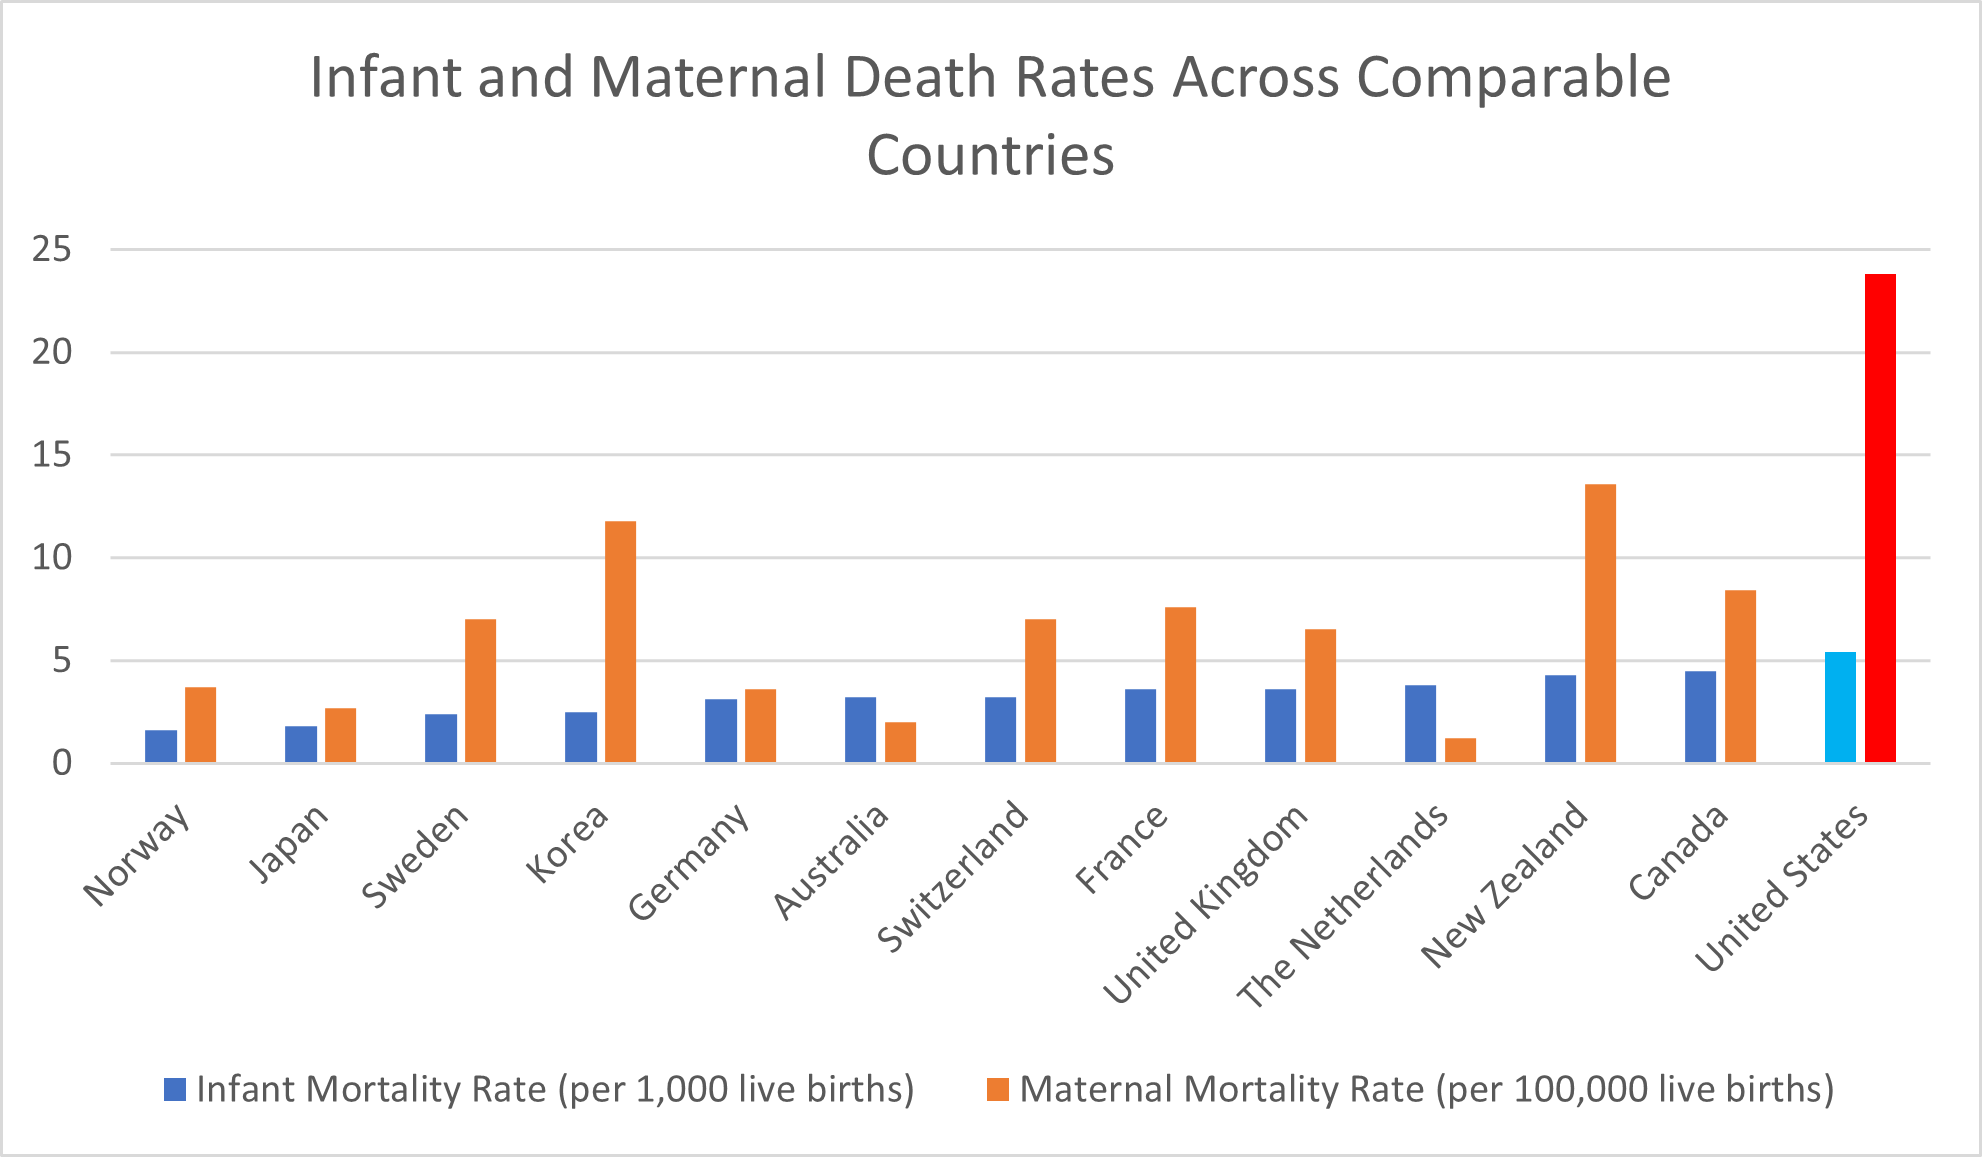
A particularly grim indictment of the quality of the U.S. health system is its high rate of both maternal mortality and infant mortality. Compared to other high-income countries, babies and their mothers are more likely to die in the United States health care system.
For every 1,000 live births, 5.4 infants die in the United States health care system, The Commonwealth Fund reported. That’s more than 3 times the 1.6 infant mortality rate in Norway and exactly 3 times the 1.8 infant mortality rate in Japan. Compared to Sweden and Korea, with their respective 2.4 and 2.5 infant mortality rates, the U.S.’s rate of infant deaths is 2.25 times higher.
Germany reported an infant mortality rate of 3.1, while both Australia and Switzerland reported infant mortality rates of 3.2. The U.S. infant mortality rate is almost 70% higher.
In both France and the U.K., the infant mortality rate is 3.6, while the Netherlands reported an infant mortality rate of 3.8. In comparison, the U.S. rate remains more than 40% higher. Even compared to New Zealand and Canada, with their infant mortality rates of 4.3 and 4.5, respectively, the United States has a 20% higher rate of infant mortality.
It isn’t only babies who are more likely to die in the United States health care system but also their mothers. The OECD average number of maternal deaths for every 100,000 live births is 9.8, but in the United States, it’s more than double: 23.8. Even compared to the other countries with an above-average maternal mortality rate—Korea and New Zealand, with rates of 11.8 and 13.6, respectively—this represents an increase of 2 and 1.75 times, respectively.
Compared to the country with the lowest maternal mortality rate, the Netherlands—which reported a mortality rate of 1.2—the death rate of new mothers is a nearly 20-fold increase.
Unfortunately, the U.S. health system doesn’t have the best track record of protecting and providing better health outcomes for its most vulnerable patients and populations.
Disparities in Quality of the U.S. Health System
The U.S. health system is full of disparities. Unfortunately, factors like gender and income level can all contribute to reduced access to care, lower quality of care, and ultimately worse health outcomes.
Global Gender Disparities in Health Care
Consider the findings of The Commonwealth Fund‘s 2022 issue brief “Health and Health Care for Women of Reproductive Age.”
Women in the U.S. are more likely than women in 10 comparable countries to:
- Have problems paying medical bills
- Delay or skip medical care due to cost
- Have a mental health need
- Die from avoidable deaths
- Die while pregnant or during childbirth
Of the 11 total comparable countries, only Canada reported having as high a percentage of women of reproductive age with multiple chronic conditions. Only Switzerland had a higher percentage (29% compared to 27%) of women of reproductive age spending more than $2,000 on out-of-pocket health costs than the United States.
Given all the above, it’s no surprise that women in the U.S. were the least likely to have a positive perception of their country’s health system. Only about one in four U.S. women rated the health system as “good” or higher. In comparison, 73% of women in the UK, 79% of women in Australia, and 84% of women in Switzerland gave their countries’ health care systems positive ratings.
Racial Disparities in Health in the U.S. and Beyond
Racial disparities in health care are a particularly troubling problem in the United States that, while still applicable elsewhere, hasn’t received as much attention in international comparisons. However, a 2017 Health Affairs article summed up succinctly that “the United States consistently had among the highest disparities across a diverse set of self-reported health and health care measures” compared to other nations.
The 2022 article “Advancing Health Equity: Learning from Other Countries” by The Commonwealth Fund highlighted examples of racial disparities in health care—including stereotypes, discrimination, and even reduced rates of cancer screenings and survival—in countries like Canada, the U.K., and New Zealand.
However, it’s only in the U.S. that The Commonwealth Fund, per OECD Health Data, had to distinguish between Black, white, and Hispanic women in assessing maternal mortality rates. That’s because, while the total maternal mortality rate in the U.S. amounted to 23.8 and Hispanic and white mothers died at rates of 18.2 and 19.1, Black mothers had a mortality rate of 55.3.
Socioeconomic Disparities in Health Worldwide
Health disparities across income levels in America are well-documented. The highest earners in the U.S. are better able to afford health insurance, the cost of health services, and the promising benefits of cutting-edge medical technology. They’re less likely to be unable to afford their medical bills and, Northwestern University reported in 2021, have a life expectancy up to 15 years higher than the poorest Americans of the same age.
Income disparities in health aren’t limited to the United States. Those with the most wealth in any country can better afford the cost of good health. Yet these income disparities are amplified in America.
“In nearly all countries, adults with lower income were significantly more likely than those with higher income to have multiple chronic health conditions,” The Commonwealth Fund reported in the findings from its 2020 International Health Policy Survey. “However, on nearly every measure the study used, income-related disparities were greatest in the U.S.”
More specifically, compared to those in other countries, lower-income adults in the U.S. were more likely to:
- Have multiple chronic conditions
- Struggle to afford food, housing, and basic necessities for survival and good health
- Skip medical care due to the cost
In the U.S., the impact of being low-income ricochets through the health system. Low-income Americans can’t afford to eat nutritious foods that can help them achieve good health, afford the costs of achieving optimal physical fitness, or pay for the medical services they need to prevent or treat their medical conditions. They’re also more likely to be living in areas severely affected by pollution in the environment and be exposed to toxic chemicals in the products they buy, like plastic food storage containers from discount stores. Simply put, they can’t afford to prioritize their health, and that affects their physical, mental, and financial well-being.
What’s Behind the Poor Quality of the U.S. Health System
The data presents a clear picture of health care in the U.S. as it compares to the rest of the world: the highest costs for the poorest outcomes. The question is, why?
Are Americans simply the victims of their own unhealthy lifestyle choices, like poor diet and lack of exercise? Is our aging population—proof of people living long enough to have the privilege of getting old—making the overall U.S. population appear less healthy than the real population of working-age adults actually is? Not according to the experts.
“Neither the age structure nor the lifestyle of the US population can properly explain the much higher spending,” the researchers behind an OECD report concluded in 2022. The poor outcomes noted above refute any claims that this high price tag is matched by a high quality of care.
The more likely reason for poor health outcomes in the U.S. is a lack of health care use. In addition to the high costs we’ve already covered, a relative lack of health care providers and space in health care facilities plays a role in the U.S. health system. For both physician visits in all settings and the number of practicing physicians for 1,000 people, the U.S. reported below-average rates, according to The Commonwealth Fund. The country also has a lower-than-average number of hospital beds per 1,000 people.
Although it may sound counterintuitive, skipping or delaying care also contributes to ultimately higher costs of health care.
In a country with easy and affordable access to health care services, patients are more likely to undergo recommended screenings, take their medication as directed, and see a doctor early on when a medical condition presents itself. In many cases, this sort of early screening or diagnosis allows for a better prognosis with less extensive medical interventions—leading to better outcomes and lower costs.
Waiting to get care because of the cost can actually make the eventual expense of treatment much higher, as well as leaving patients with worse outcomes. Unfortunately, that’s what often happens in the United States, where healthcare costs are so high that only the wealthy rarely have trouble affording care. When Americans do get care, the high cost may leave them struggling under the weight of medical debt.
What the U.S. Health Care System Gets Right
We’ve talked a lot about what the United States health care system gets wrong. Between spending the most money and achieving for that investment the lowest life expectancy among our peer countries, the data may seem pretty bleak. There are, however, some bright spots.
The United States is among the countries with the highest rates of both breast cancer screenings and colorectal cancer screenings. In the U.S., 77% of female patients ages 50 to 69 undergo breast cancer screenings, compared to just 54.6% of such patients in the average OECD country, The Commonwealth Fund reported. Among all patients ages 50-74, 68% undergo colorectal cancer screenings in the U.S., while just 44% of patients in the average OECD country do.
“The U.S. does relatively well with cancer prevention,” The Commonwealth Fund reported, noting that “this is likely a reflection of extensive screening and detection, a key to diagnosing breast and colorectal cancers early and beginning treatment in a timely manner.”
The United States is also among the leading countries in performing hip replacements that, The Commonwealth Fund noted, “can substantially improve an individual’s quality of life.” For every 1,000 patients age 65 and up, the United States performs 15.6 hip replacements. Among high-income countries, only Switzerland performs more hip replacements, with a rate of 16.4 per 1,000 patients. The OECD average is just 9.4 per 1,000 patients.
Additionally, supplement use in America is common—and growing.
What these successes illustrate is that the United States can make positive progress in improving health outcomes. These improvements tend to build upon one another, as evidenced by the symbiotic growth of the fitness and supplement industries, efforts to improve the supplement industry, and the positive impact staying healthy has on one’s personal finances.
The challenge is to achieve such progress in system-wide health quality improvement efforts—and that’s a much more complex undertaking.