
With scientific advances and the relative ease of access to nutritious food, safe drinking water, and medicines and supplements, the seemingly obvious conclusion would be that Americans are healthier today than they were about half a century ago. Health in America has changed for the better by some indicators, but by many measures, Americans today are in worse health than their parents or grandparents were at the same age.
Better: Life Expectancy in the U.S. Has Increased by a Decade Since 1960
The most obvious improvement in health in America is the increase in life expectancy. Since 1960, life expectancy at birth in the United States has increased by more than a decade.
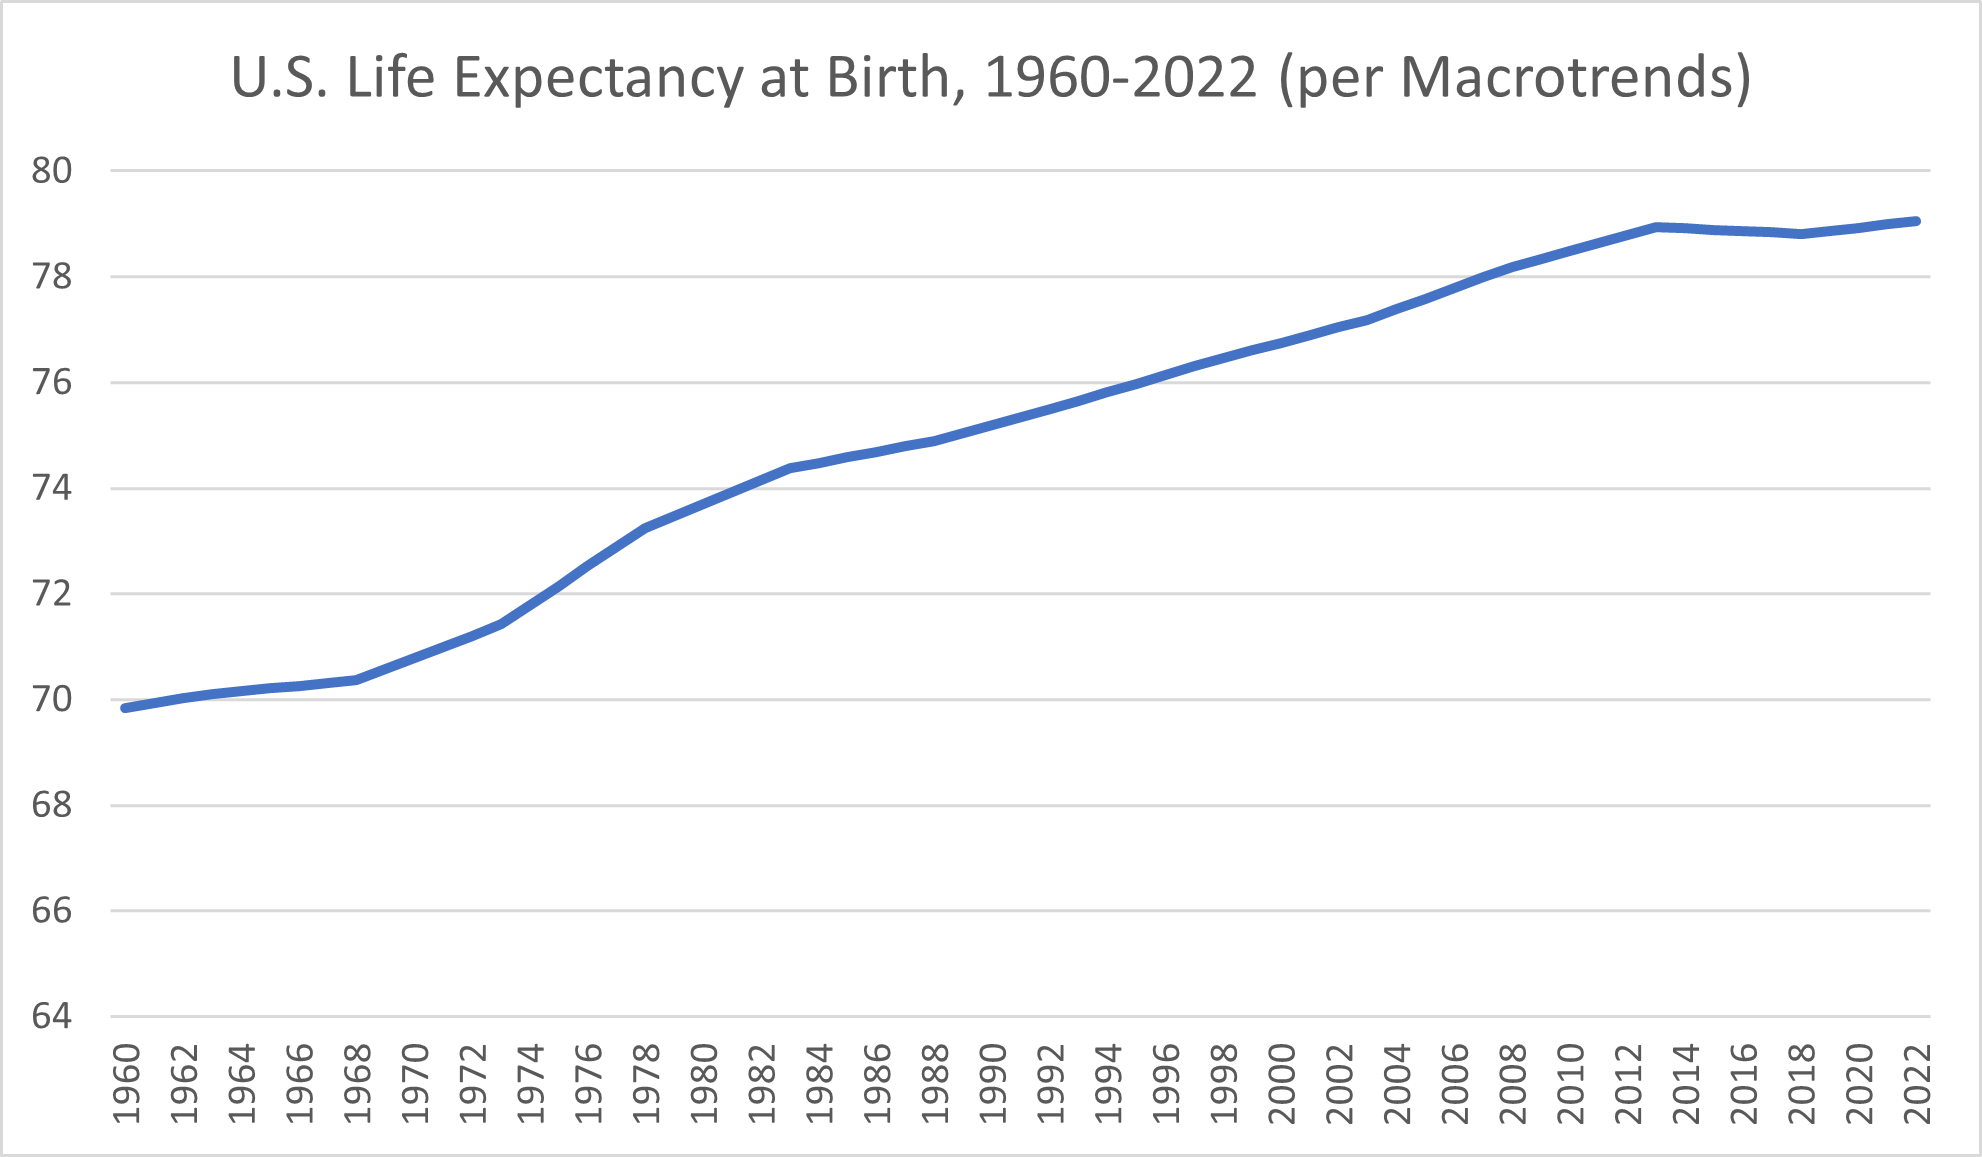
At the end of 1960, life expectancy at birth in the U.S. was 69.84 years, according to research platform Macrotrends. Americans born a decade later gained more than 11 months, with the 1970 life expectancy at birth amounting to 70.784 years. By 1975, life expectancy at birth had reached 72.152 years.
The 1980s began with a life expectancy at birth of 73.698 years and ended in 1989 with a life expectancy of 75.042 years. The next decade saw life expectancy rates climb from 75.194 years in 1990 to 76.612 at the end of 1999. Americans born at the start of the new millennium had a life expectancy of 76.754 years. By 2009, the life expectancy had increased to 78.34.
Despite starting strong with a life expectancy at birth that rose from 78.49 years to 78.94 during the first few years of the decade, the 2010s proved to be a less favorable time for Americans’ health, particularly as longevity goes. From 2014 through 2018, Macrotrends reported slight declines in life expectancy that ultimately amounted to a loss of more than a month and a half of life compared to 2013’s high. Still, those losses turned back into gains in 2019, and the early 2020s saw U.S. life expectancy at birth rates exceed 79 years for the first time.
The decade of longevity gained among Americans since 1960 is promising, but it isn’t all good news.
For one thing, life expectancy in the United States lags behind that of comparable countries, according to data from the Organisation for Economic Cooperation and Development (OECD). The international organization reported that reduced gains in life expectancy in several countries predated the COVID-19 pandemic but that “this slowdown was most marked in the United States” and a few other nations. The distinction between the U.S. and the country with the highest life expectancy at birth, Japan, translated to 5.5 years in 2019, the OECD reported. In fact, the life expectancy in America was below average.
To make things worse, it’s worth noting that only certain groups of Americans are seeing the full potential of an increase in life expectancy—namely, the wealthy.
The rich have a long history of living longer than the poor, but in America, that gap has only widened over the past century. While that difference in life expectancy between the wealthiest and poorest American men was once around five years, it had climbed to 15 years by 2014, according to The Equality of Opportunity Project. Further, a 2016 article by U.S. News & World Report noted that factors like race, ethnicity and location affected longevity, with differences in life expectancy across counties throughout the United States amounting to up to 30 years.
Better: Health Insurance Coverage Has Increased From 10% to 92% Since 1940
Another win for the American health care system is an increase in the proportion of Americans who have health insurance. Health insurance coverage is critical for improving access to health care services in our expensive health system. At least theoretically, having health insurance coverage serves to increase access to providers and allow patients to get medical care not only when they need it but, ideally, on a preventive basis.
Only around one in ten Americans had health insurance in 1940, the American Enterprise Institute reported. The low percentage of Americans with private insurance prompted the government to get involved in 1943—not by offering public insurance but rather by awarding tax subsidies to encourage employers to offer health insurance to their employees. This effort succeeded in ensuring that an estimated 75% of Americans had health insurance by 1960.
Both private insurance and public insurance (Medicare and Medicaid) contributed to the 85% of Americans who had health insurance in 1970, the American Enterprise Institute reported. For decades, the percentage of Americans with insurance remained relatively stable. The upshot was that tens of millions of Americans had no health insurance, and many Americans who were insured found that their policy didn’t cover the essentials. The next big increase in health insurance coverage would follow the passage and implementation of the Affordable Care Act of 2010, also known as Obamacare. The 2022 Census reported that 92.1% of Americans had health insurance.
Unfortunately, the theoretical access to health care professionals that comes with health insurance coverage doesn’t always equate to better health outcomes in the real world.
Worse: Chronic Conditions Are on the Rise Among American Adults
Just because people are living longer doesn’t necessarily mean they’re living better. What about the chronic conditions Americans live with today compared to in decades past? How do these conditions affect the quality of life?
Suffering from chronic diseases can make you far more likely to develop more serious injuries, illnesses, and medical complications. Chronic conditions also affect your quality of life even when they aren’t contributing to other medical problems. Carrying too much weight may contribute to joint pain. Managing type 2 diabetes requires you to check your blood sugar daily and take insulin injections.
What’s particularly noteworthy is how extensively these chronic conditions are affecting adults in their prime, not just late in life. While 40% of adults over 50 are obese, so are 30% of young adults in the 25-to-29 range, a 2017 Bureau of Labor Statistics Monthly Labor Review article reported.
Health statistics show that the number of Americans with at least one chronic disease is nearly 60%, the National Association of Chronic Disease Directors reported in 2022. Many Americans—42%, the RAND Corporation reported in 2017—have more than one chronic condition.
This wasn’t always the case. Over the past few decades, the rates of numerous chronic diseases in the United States have surged. How much more widespread are obesity, diabetes, and other serious chronic diseases now compared to even a generation or two ago?
Worse: The Obesity Rate Has Tripled From 13% in 1960 to more than 40% Now
The not-for-profit organization USAFacts reported in 2023 that obesity rates had tripled over the past 60 years.
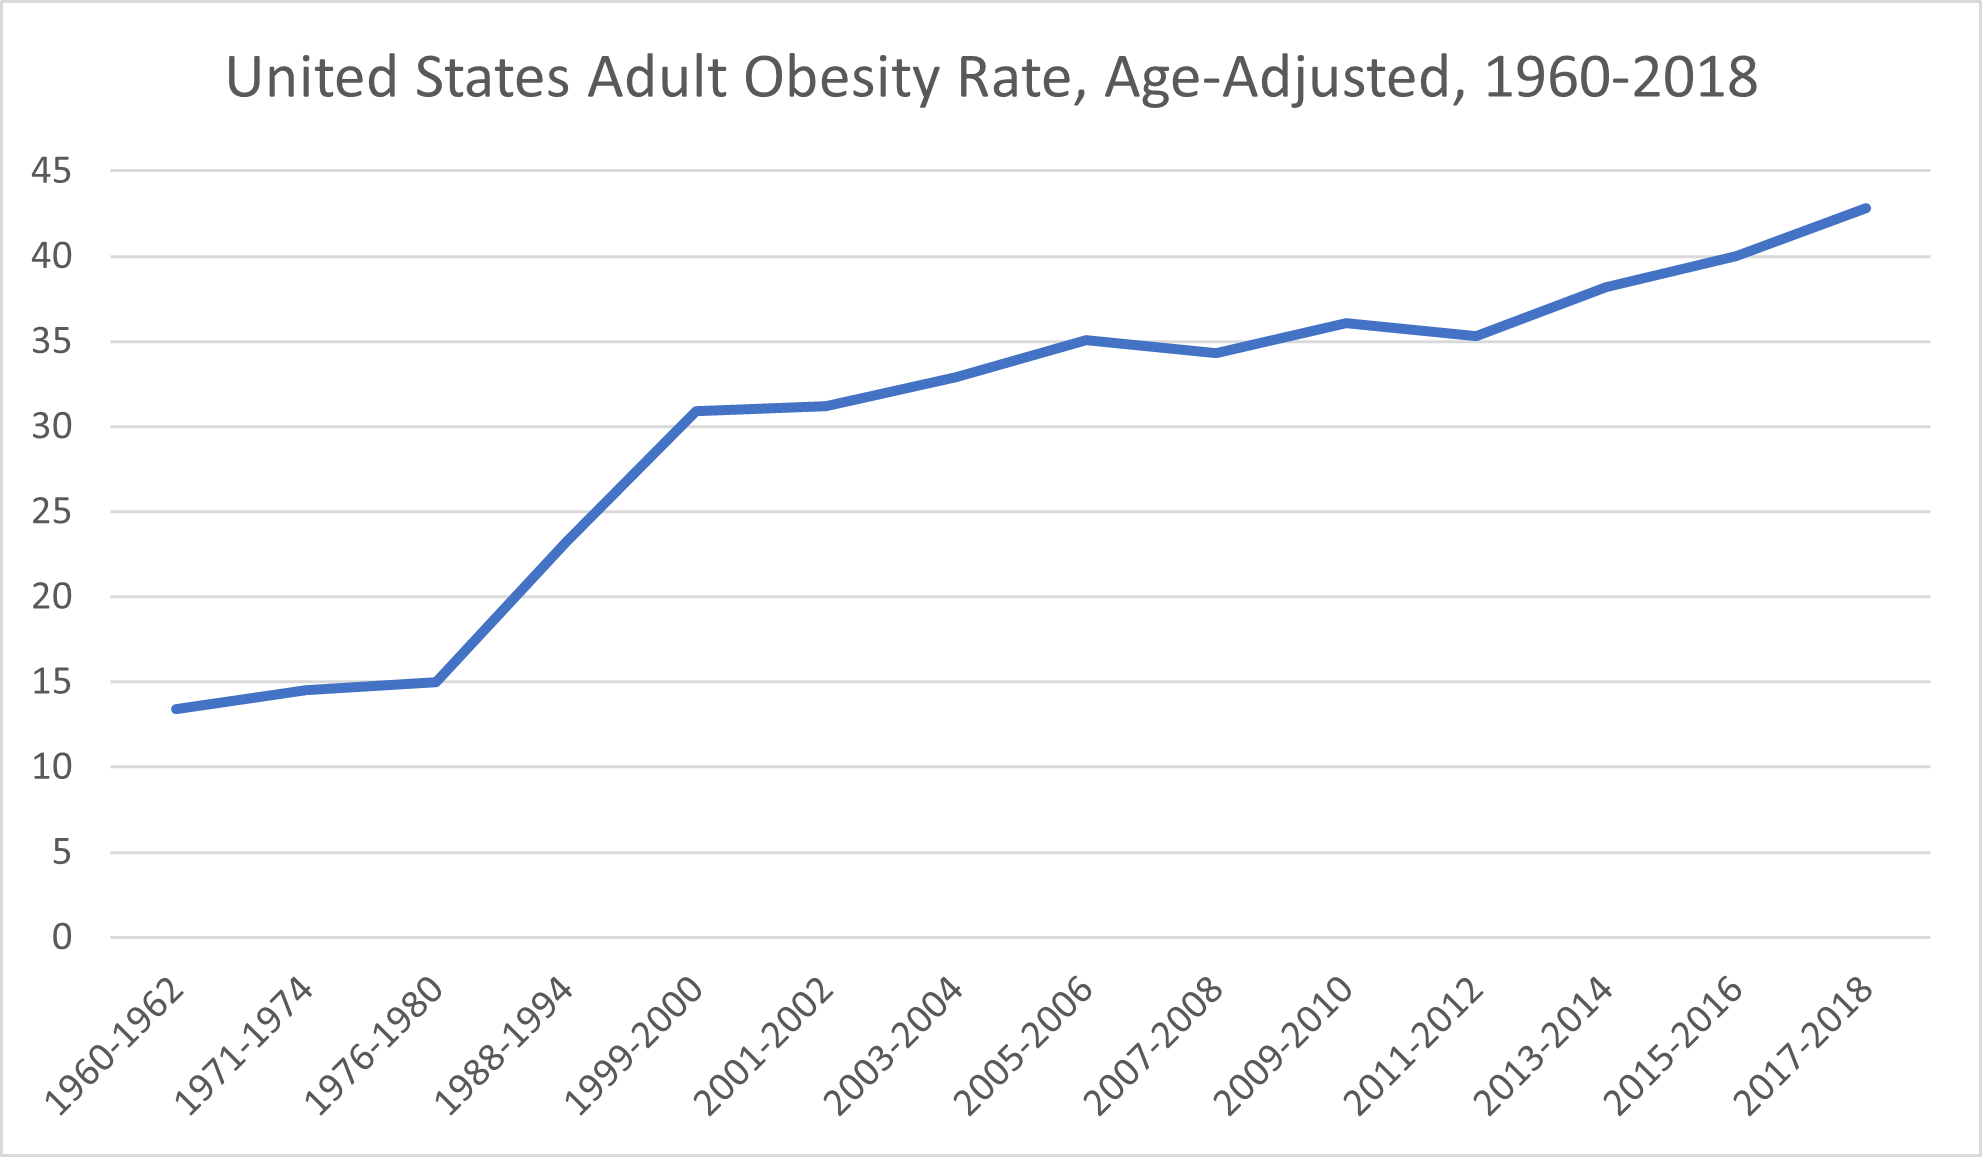
Basing its conclusions on data from decades’ worth of National Health and Nutrition Examination Surveys, USAFacts reported an age-adjusted national obesity rate of 13.4% for the 1960-1962 survey period. The obesity rate climbed to 14.5% for the 1971-1974 period and then 15% for the 1976-1980 period.
The next two periods, 1988-1994 and 1999-2000, saw considerably larger increases in obesity rates, which jumped first to 23.2% and then to 30.9%. From there, obesity rates among American adults have generally trended upward.
The 2001-2002 data indicated an obesity rate of 31.2%. The obesity rate for the 2005-2006 period was 35.1%. Despite a brief drop to 34.3% during the 2007-2008 period, the obesity rate rose again to 36.1% for the 2009-2010 period. The 2011-2012 period saw another slight decrease to 35.3% before increasing to 38.2% during the 2013-2014 period. By the 2015-2016 period, a full 40% of the U.S. adult population was considered obese, and that percentage only increased during the 2017-2018 period, reaching 42.8%.
The prevalence of the increases in adult obesity rates suggests that the cause isn’t as simple as individuals willfully making unhealthy diet and exercise decisions. Rather, socioeconomic and environmental factors likely contribute to the rising obesity rate and, in particular, to disparities in obesity rates across racial and ethnic minority populations, the CDC reported. Often, people in historically marginalized groups have higher rates of food insecurity, reduced access to safe and convenient places to get regular physical activity, and little access to health care services.
Worse: Diabetes Has Increased by 455% Among American Adults
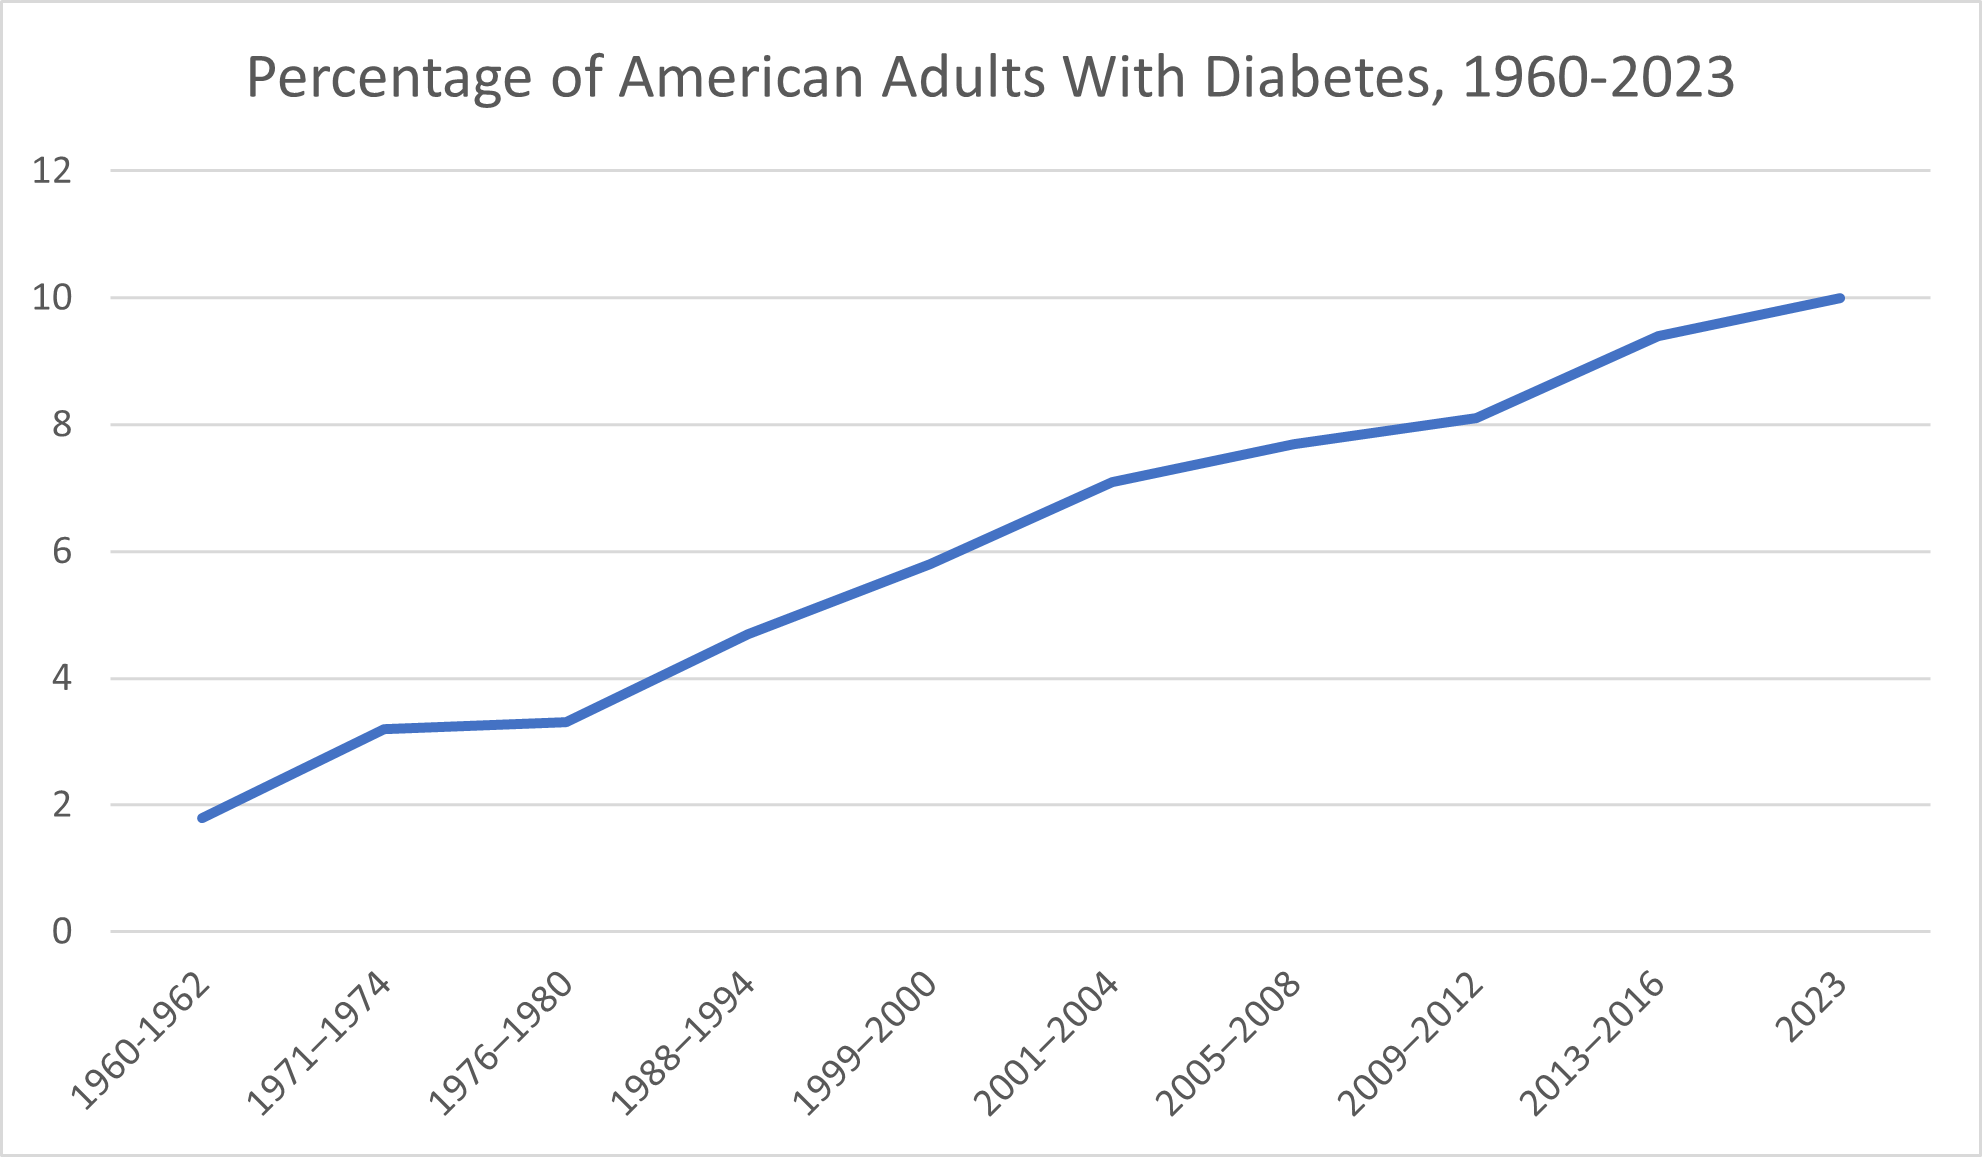
According to the American Diabetes Association, only around 1.8% of the United States population was diagnosed with diabetes during the 1960–1962 years. By the 1971-1974 period, that proportion had increased to 3.2%. The 1988-1994 period saw 4.7% of Americans have a diagnosis of diabetes. By the 1999-2000 period, 5.8% of Americans had diabetes.
During the 2005-2008 years, the CDC reported that 7.7% of American adults had been diagnosed with diabetes. That proportion increased still further for the 2009-2012 years, climbing to 8.1%. From 2013-2016, the CDC reported, 9.4% of Americans had been diagnosed with diabetes. The CDC reported in 2023 that around 10% of Americans have diabetes.
Worse: The Prevalence of Food Allergies Worldwide Has More Than Doubled Since 1960
Food allergies, some of which can be life-threatening, are on the rise not only in the U.S. but across the globe. A 2020 BBC article reported that the worldwide rate of food allergies has increased from 3% in 1960 to 7% in 2018. In a 2019 study published in the American Medical Association’s journal JAMA Network Open, researchers concluded that up to 10.8% of adults may have food allergies.
Worse: Autism Diagnoses Increased 50- to 100-Fold Between 1966 and 2020
In the 1960s, when the first research studies on the prevalence of autism were conducted, researchers concluded that only 2 to 4 children out of 10,000 had autism, the 2015 book Mental Disorders and Disabilities Among Low-Income Children reported. That works out to just 0.02% to 0.04% of the population.
Today, 1 in 36 children in America has a diagnosis of autism spectrum disorder, according to the CDC. That works out to a percentage of around 2.77%. Depending on which 1960 figure you compare, this change amounts to a 50-fold to 100-fold (or more) increase in autism diagnoses.
One reason it’s difficult to reliably compare autism spectrum disorder prevalence across the last 60+ years is because what symptoms constitute autism, per the Diagnostic and Statistical Manual (DSM), have changed significantly. For example, what’s recognized as autism spectrum disorder today encompasses what, from 1994 through 2013, the DSM referred to as Asperger syndrome—a condition that not only wasn’t recognized at all in the 1960s but also has since been introduced and then removed as a standalone diagnosis in the DSM. To put in perspective the challenges of comparing the prevalence of autism spectrum disorders today with that of the 1960s, autism itself wasn’t even part of the DSM until 1980, Scientific American reported.
Early diagnoses of autism not only limited the diagnosis to patients who matched all symptoms of the condition but also strictly limited the age before which symptoms must have been exhibited to qualify for the diagnosis. Most patients diagnosed with autism before the ’80s were institutionalized, Scientific American reported. This reality reflects not only the lack of visibility of the condition during the 1960s and 1970s but also the severity of symptoms and impairment among people who qualified for the diagnosis.
The broader definition of autism and the guidelines for diagnosing it have played a part in the dramatic increase in the number of autism diagnoses among the U.S. population. So have the modern visibility of the condition, including routine screenings for autism by pediatric health care providers. However, experts caution that this doesn’t mean autism is over-diagnosed. Rather, as USA Today reported, the “much more accurate” methods researchers use today mean that more recent rates of autism prevalence “gloss over fewer cases in the general population.”
Researchers today are eyeing an assortment of factors that they believe may cause or contribute to developing autism: inherited genetic factors, exposure to air pollution or toxic chemicals, vitamin deficiencies, viral infections and more, according to NBC News.
Worse: Childhood Eczema Incidence Increased 10-Fold Between 1960 and 2013
Eczema is, unfortunately, one example of health conditions that are on the rise in the United States specifically. In fact, the National Eczema Association reported that children who are born outside the United States have a 50% lower risk of developing atopic dermatitis compared to children born in America—and that their risk climbs once they have lived in the United States for 10 years.
Before 1960, just 2-3% of children in the United States had atopic dermatitis, according to research published in 2013 in The Journal of Investigative Dermatology. A significant jump occurred over the next decade, bringing the prevalence up to 9-12%. By the time of the 2013 article publication, the researchers noted, the incidence of childhood atopic dermatitis had increased as high as 20%.
Eczema can amount to so much more than mild skin irritation. The damage eczema does to the skin can leave sufferers susceptible to viral, bacterial, and fungal skin conditions, the International Eczema Council reported. The condition has also been linked to both allergic and non-allergic conditions and may decrease patients’ quality of life by interfering with sleep and negatively impacting self-esteem and mental health.
Worse: Depression Rates Are on the Rise
In the 1960s, researchers and health care professionals paid more attention to anxiety than depression, a 2010 article published in the journal Milbank Quarterly reported. Yet some of what researchers and health care providers then viewed as anxiety would eventually be categorized under depression. Between 1960 and 1975, the prevalence of depression increased among Americans of all ages, according to a 1989 JAMA article.
One reason depression rates are difficult to track is because of the discrepancies in characterizing depression. The CDC put the proportion of American adults who experience “regular feelings of depression” at 4.7% as of 2023. A 2023 Gallup article addressed both lifetime rate of depression diagnosis and current depression diagnosis—and noted that both had increased drastically since 2015, from 19.6% to 29% and 10.5% to 17.8%, respectively.
Whatever measures you look at, the consensus is that depression is, as a 2012 Journal of Affective Disorders article put it, “a disease of modernity.” Explanations for this increasing incidence of depression range from declines in physical health (including higher rates of chronic diseases), inadequate sleep and nutrition, social factors and an overall increase in psychiatric disorders and mental illness.
Americans Are Taking More Medications
With so many chronic health conditions on the rise in the United States, a higher rate of medication usage is unsurprising, if disconcerting. How much more are we medicating ourselves than in times past? What does our increased reliance on medication say about our overall health and well-being now compared to 20, 50, or 70 years ago?
Even in the 1960s, medications were a major part of the American health system, playing a considerably bigger part than in other countries’ health systems. Not only did the “relatively inexpensive” drugs of the time (along with durable medical goods) still manage to account for 20% of private health expenditures, but it was “a common belief… that the United States was the most overmedicated country in the world,” researchers wrote in a 1996 article published in Health Care Financing Review.
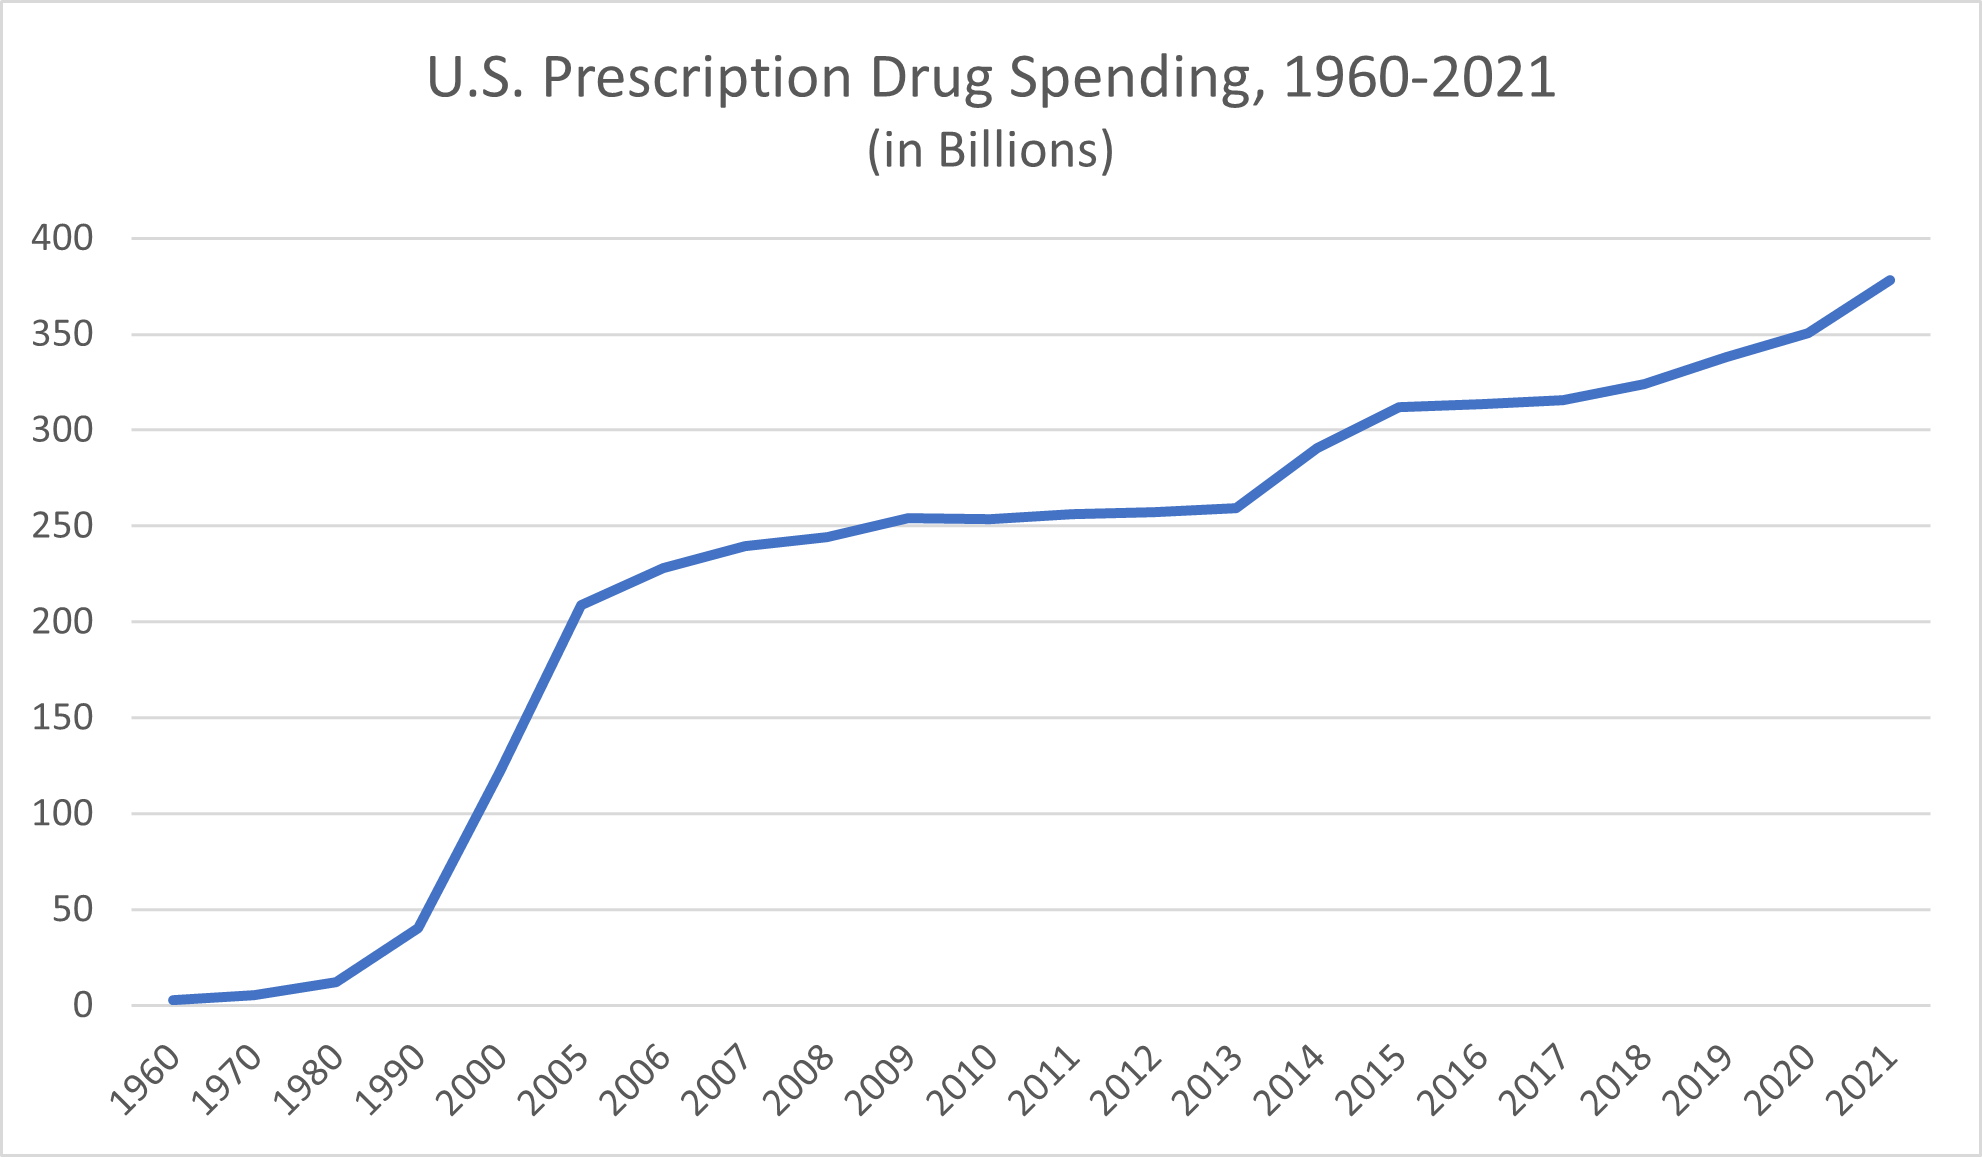
Data pertaining to exactly what proportion of Americans used prescription drugs regularly as far back as the 1960s (or even the 1980s) is elusive, but the available data on prescription drug expenditures is telling. In 1960, Statista reported, total prescription drug spending in the U.S. amounted to $2.7 billion. The $5.5 billion prescription drug expenditure reported for 1970 marked a doubling of 1960’s drug spending, but it pales in comparison to that of the next few decades. In 1980, the U.S. spent $12 billion on prescription medications. By 1990, that figure had climbed to $40.3 billion.
After 2000, when prescription drug spending reached $122 billion, data is more widely available. In 2005, Americans spent $208.6 billion on prescription drugs, and by 2009, that amount exceeded $250 billion. By 2015, prescription medication spending in America reached a new high of $312.2 billion. U.S. prescription drug spending surpassed $350 billion in 2020 and continued to climb to $378 billion in 2021.
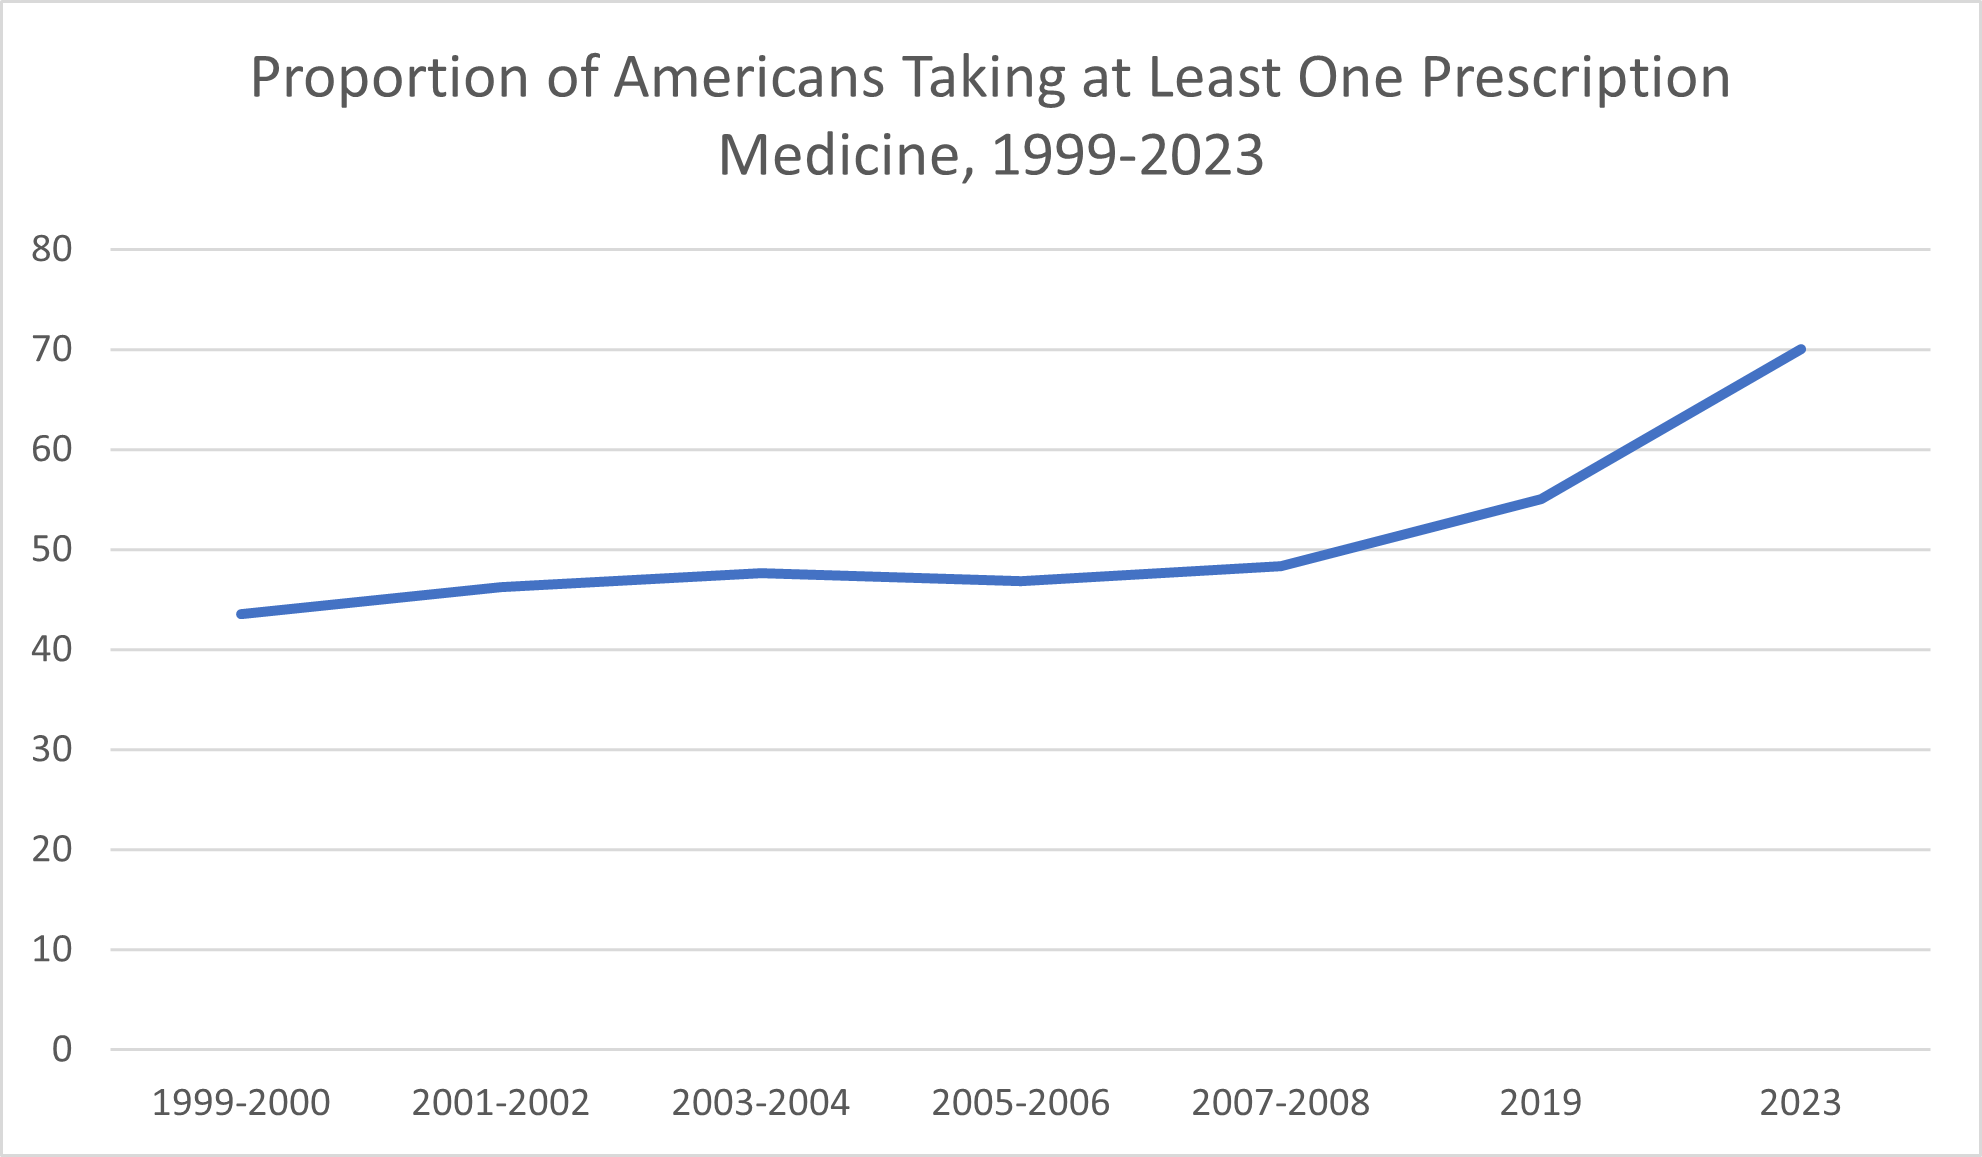
More definitive data exists on the proportion of Americans who regularly have taken prescription medications over the past 25 years. The CDC reported that 43.5% of Americans took prescription drugs in 1999-2000. By 2007-2008, that proportion had climbed to 48.3%. By 2019, Civic Science reported, around 55% of Americans reported taking at least one prescription medication; in 2023, that proportion increased to nearly 70%.
Americans today are also taking record numbers of supplements.
Is this increase in medication use a change for the better, the worse, or a little of both?
Taking more medications is a good thing when the increase reflects breakthroughs in effective medications for serious conditions and increased access to the drugs patients need through their health plans. For example, widely used medications like beta-blockers and statins weren’t discovered until the mid-’60s and late-’80s, respectively, Duke University Press reported. To the extent that this increase in taking medications reflects patient’s ability to see health care professionals when needed (and for preventive care) and to access health services that can help them live longer and fuller lives, the consequence of more medications is favorable.
The aging population in the U.S. also plays a part in the rising medication usage, as evidenced by the data that says that 85% of adults ages 60 and up reported taking medications. When otherwise relatively healthy people live as much as a decade longer thanks to medication compared to a couple of generations ago, that, too, is a positive outcome.
Unfortunately, the increase in the number of medications Americans are taking isn’t fully explained by the better availability of effective drugs and health care services. As evidenced by the increase in chronic illnesses explored above, Americans are, in many ways, less healthy than they once were. When more people have to take medications (which carry side effects and pose potentially serious health risks) to manage a health problem that didn’t use to be so prevalent, it reflects not only the state of health in the U.S. but also the sacrifices Americans make to manage their health conditions. Doing so isn’t always as simple as taking a pill—not when there are side effects and financial burdens that go along with the use of medications and supplements.
Worse: National Health Spending Has Increased 150-Fold From the 1960s Through Today
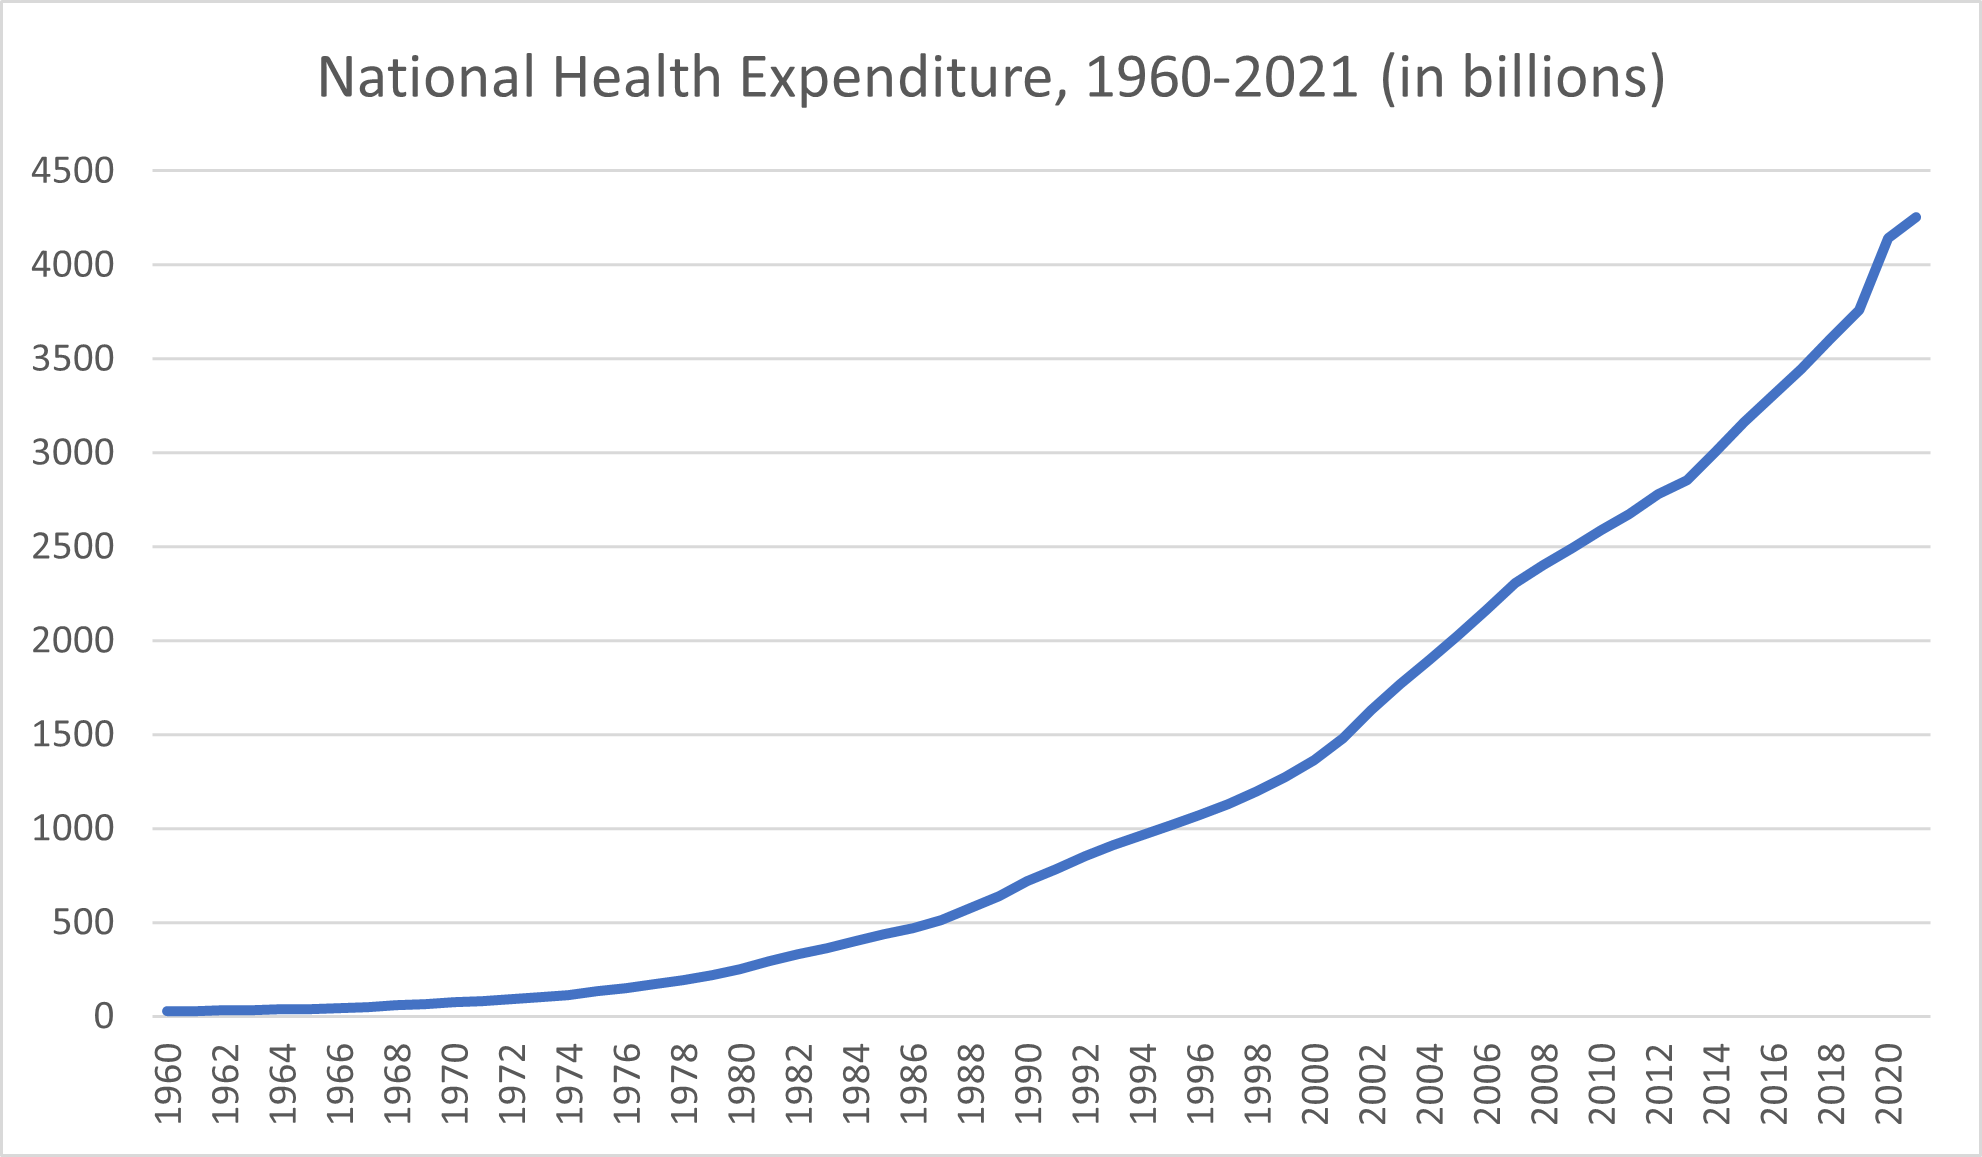
From a financial standpoint, overall health spending in the United States has skyrocketed since 1960. The national health expenditure in 1960 amounted to $27.1 billion, the Centers for Medicare & Medicaid Services reported. Health spending exceeded $30 billion by 1962 and $40 billion by 1965. National health expenditures topped $50 billion per year by 1967 and, by 1969, surpassed $65 billion.
Throughout the 1970s, national health spending climbed from $74.1 billion to $219.7 billion. The 1980s kicked off with a national health expenditure of $253.2 that had more than doubled by 1987, reaching $514.5 billion. The early 1990s saw healthcare spending rise from $718.7 billion to $966.4 billion. It was in the mid-1990s that health expenditures first crept into the trillions, beginning with a $1.0203 trillion expenditure in 1995.
By 2000, the annual health spending had reached $1.366 trillion. The first decade of the new millennium would end with health expenditures of $2.4927 trillion, while the 2010 annual health expenditure amounted to $2.5896. By 2014, national health expenditure exceeded $3 trillion. The national health spending in 2020 amounted to $4.1441 trillion and, in 2021, climbed to $4.2551 trillion.
On their own, health spending growth increases over the span of decades aren’t necessarily good or bad. Spending more on health because scientific breakthroughs offer effective preventive care options and interventions that never existed before is a net positive, especially when that health spending growth remains in line with other economic trends.
However, if health spending growth increases are far out of proportion compared to other areas of economic growth (they are) or if actual health outcomes don’t justify the increase (they don’t), the spiraling health spending growth rates are worrisome. Much of the increase in overall health care costs can be attributed to administrative costs, rising prices of drugs and supplies, private insurance premiums and increases in other healthcare prices—and these excessive costs leave many Americans with medical debt. In many ways, the high cost doesn’t reflect a more effective use of health services, greater success on the part of the American health system in improving health, or an outcome of more healthy people in the U.S.—just more money spent.
Worse: The Impact of the Covid-19 Pandemic on Health in the United States
As we look at health changes in America over the past 60+ years, one thing we can’t ignore is the impact of the COVID-19 pandemic.
In 2020, more than 350,000 American deaths were attributed to COVID-19, according to the CDC. With this exceptionally high death toll, COVID-19 beat out deaths from accidents to become the third-leading cause of death in the U.S.
Naturally, a new disease with such a high death toll affected death rates in the United States more broadly. The overall death rate in the country increased by 17% between 2019 and 2020, climbing from 715 deaths per 100,000 Americans to 835 deaths per 100,000 Americans, the CDC reported.
Unfortunately, 2020 also saw death rates across several other leading causes of death increase, with COVID playing at least some part. For example, Americans who avoided getting medical care for their chronic conditions or acute symptoms or who missed preventive screenings and routine tests because of the pandemic may not have died directly from COVID, but the pandemic still prevented them from getting the interventions that may have saved their lives.
All told, life expectancy declined in 2020 by 1.8 years, the CDC reported, and that decline was primarily attributed to the COVID-19 pandemic. While most countries reported a decline in life expectancy due to COVID-19, the United States is among the nations where COVID’s impact on life expectancy has lingered, TIME reported. Scientific American went even further, stating that “the U.S. decline has been steeper and longer than most” other countries.
Among survivors, COVID-19 can continue to affect health beyond the acute stage of infection.
Without decades of prior data to compare, it’s too soon to say for sure what sort of long-term impact the COVID-19 pandemic will have on health in America. One of the biggest mysteries revolves around the potential virus-associated chronic ailments that could result from COVID-19 infection, in the same way that the dormant chickenpox virus can give rise to shingles decades later.
Already, researchers are studying the assortment of symptoms that together make up “Long COVID.” The ongoing health concerns that result from COVID-19 infection may linger for weeks, months, or even years, the CDC reported. Although individuals whose infections were categorized as “severe” have a greater likelihood of suffering Long COVID symptoms, even people whose initial infection was relatively mild may suffer ongoing health issues because of the virus. Long COVID symptoms range from fatigue, digestive symptoms, and muscle or joint pain that affect quality of life to respiratory and heart symptoms that can be downright dangerous. Through the mechanism of Long COVID, the virus can contribute to the development of heart disease, diabetes, blood clots, and neurological conditions, according to the CDC.
As of 2023, the CDC is unable to provide an evidence-backed estimation of the proportion of Americans who develop Long COVID but noted that studies to better understand the prevalence, effects and prevention of Long COVID are currently underway. In any case, there’s reason to suspect that the proportion of COVID survivors that develop at least one long-term symptom is statistically significant. A 2021 article published in the Journal of the American Medical Association, as summarized by the American Academy of Physical Medicine and Rehabilitation, concluded that between 10% and 30% of COVID survivors surveyed experienced at least one symptom six months after the infection.
While the COVID-19 pandemic affected health outcomes, health spending, and life expectancy across all over the world, its impact wasn’t equal even among comparative countries. Nor did the COVID-19 pandemic make healthcare more equal, in spite of the uncertainty it brought. Rather, the crisis “exposed the existing holes in our health care system,” CNN Health quoted Executive Director of the American Public Health Association Dr. Georges Benjamin as saying. The pandemic made longstanding health disparities worse. Similarly, the CDC noted that health inequities may increase the risk of suffering from Long COVID for certain populations, including racial and ethnic minority groups, people with disabilities, and Americans who don’t have access to health care either due to income or geographic location.
What This Data Says About the American Health Care System
Why are so many measures of health in America changing for the worse rather than for the better?
The causes of these losses in quality of health—particularly among the young and middle-aged group of Americans—are multifaceted. They reflect factors that run the gamut from environmental exposures to lifestyle choices and socioeconomic pressures.
For example, income continues to affect health and quality of life in terms of the incidence of chronic disease—although more recent data suggests that these discrepancies are less pronounced than they once were. According to the BLS summarization, researchers found that obesity rates were similar between middle-income and low-income Americans. High-income Americans reported lower obesity rates, yet even among this group, the rate of obesity has “increased significantly,” the BLS reported.
Despite the health care breakthroughs that use cutting-edge technology to save lives or manage chronic illnesses, American health care systems are in trouble. They’re eating up a massive chunk of our country’s wealth in terms of gross domestic product while failing at delivering care that actually improves health and contributes to the population of healthy people. Generally, neither public health efforts nor health care providers have managed to combat the combined impact of these factors that are, overall, leaving Americans in worse health—in many ways—today compared to in 1960.